 ar
ar bg
bg hr
hr cs
cs da
da nl
nl fi
fi fr
fr de
de el
el hi
hi it
it ko
ko no
no pl
pl pt
pt ro
ro ru
ru es
es sv
sv tl
tl iw
iw id
id lv
lv lt
lt sr
sr sk
sk sl
sl uk
uk vi
vi et
et hu
hu th
th tr
tr fa
fa ms
ms hy
hy ka
ka ur
ur bn
bn mn
mn ta
ta kk
kk uz
uz ku
ku
load cell connection diagram
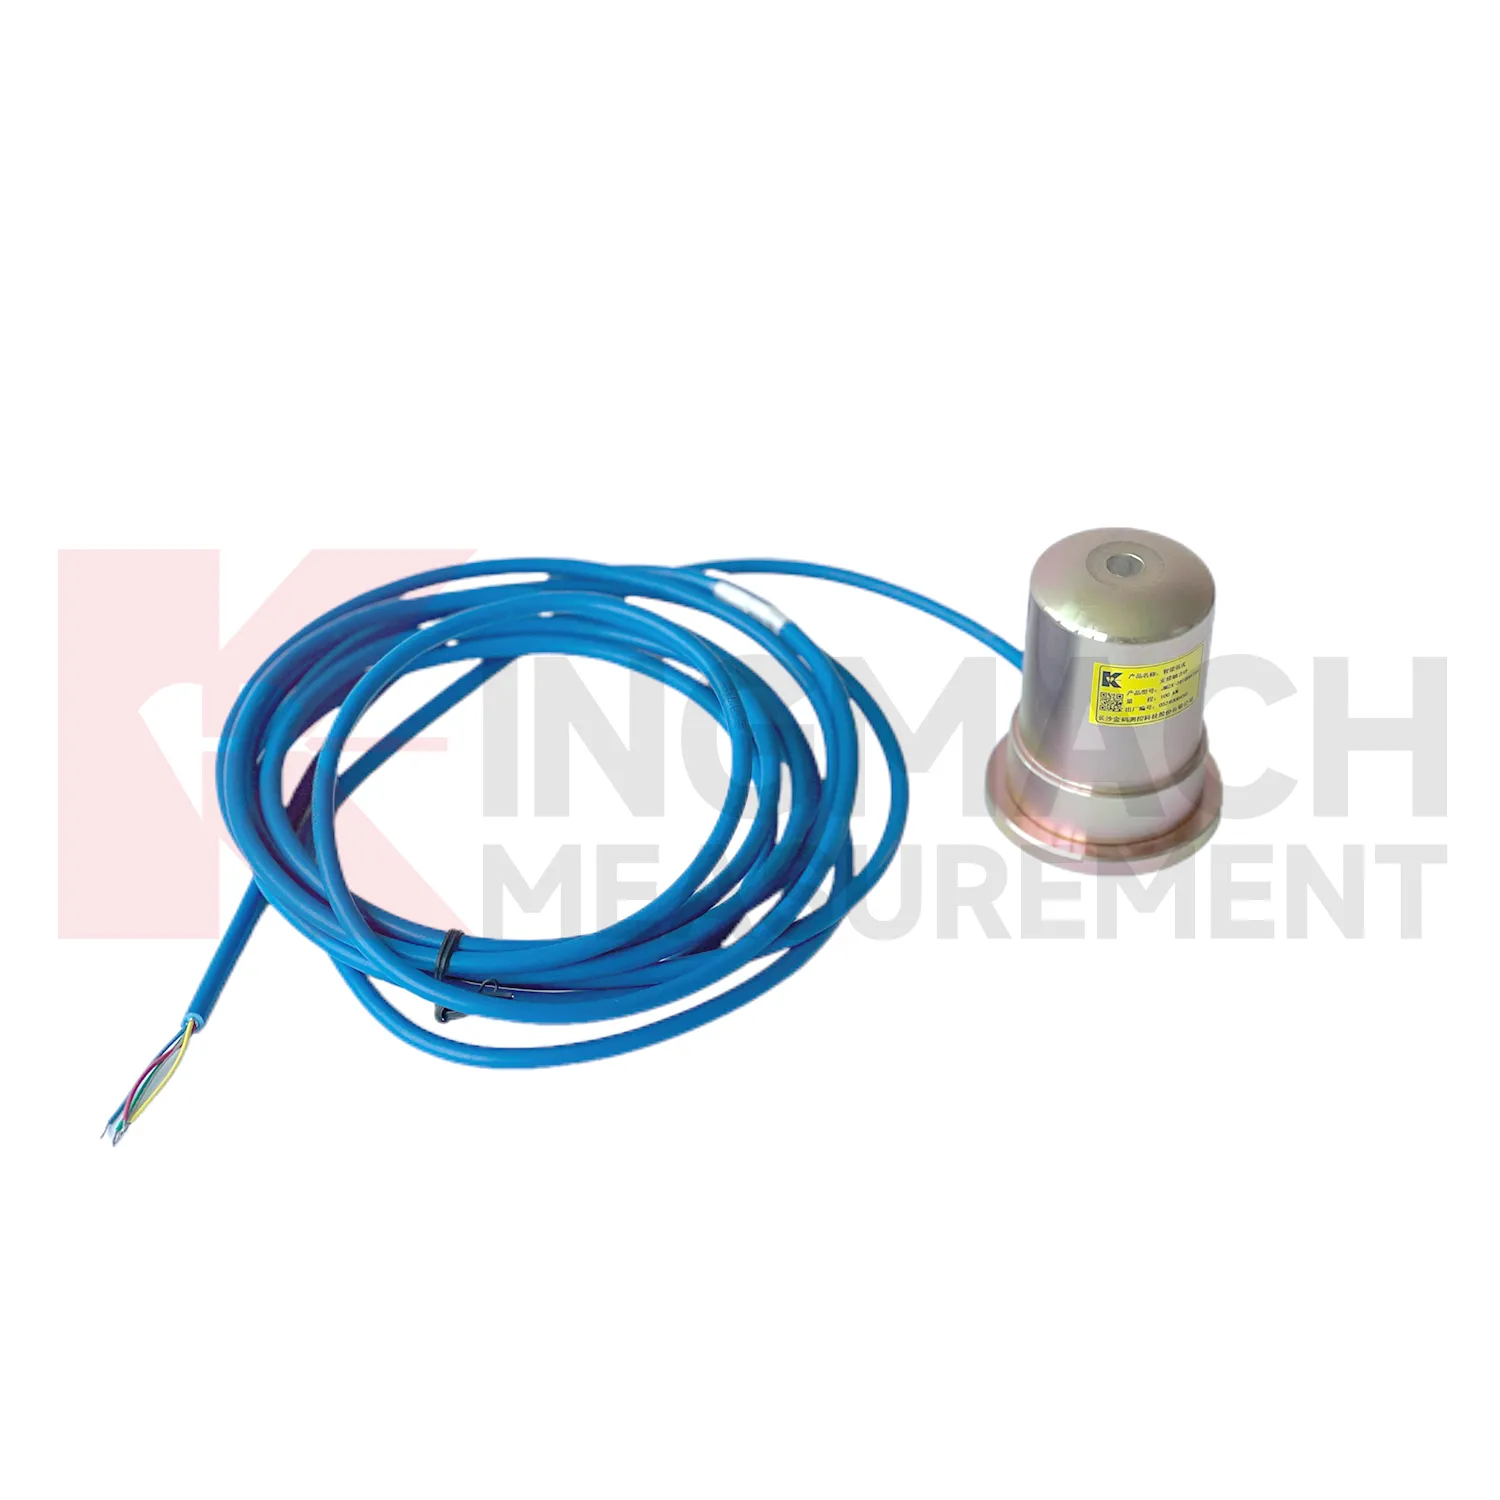
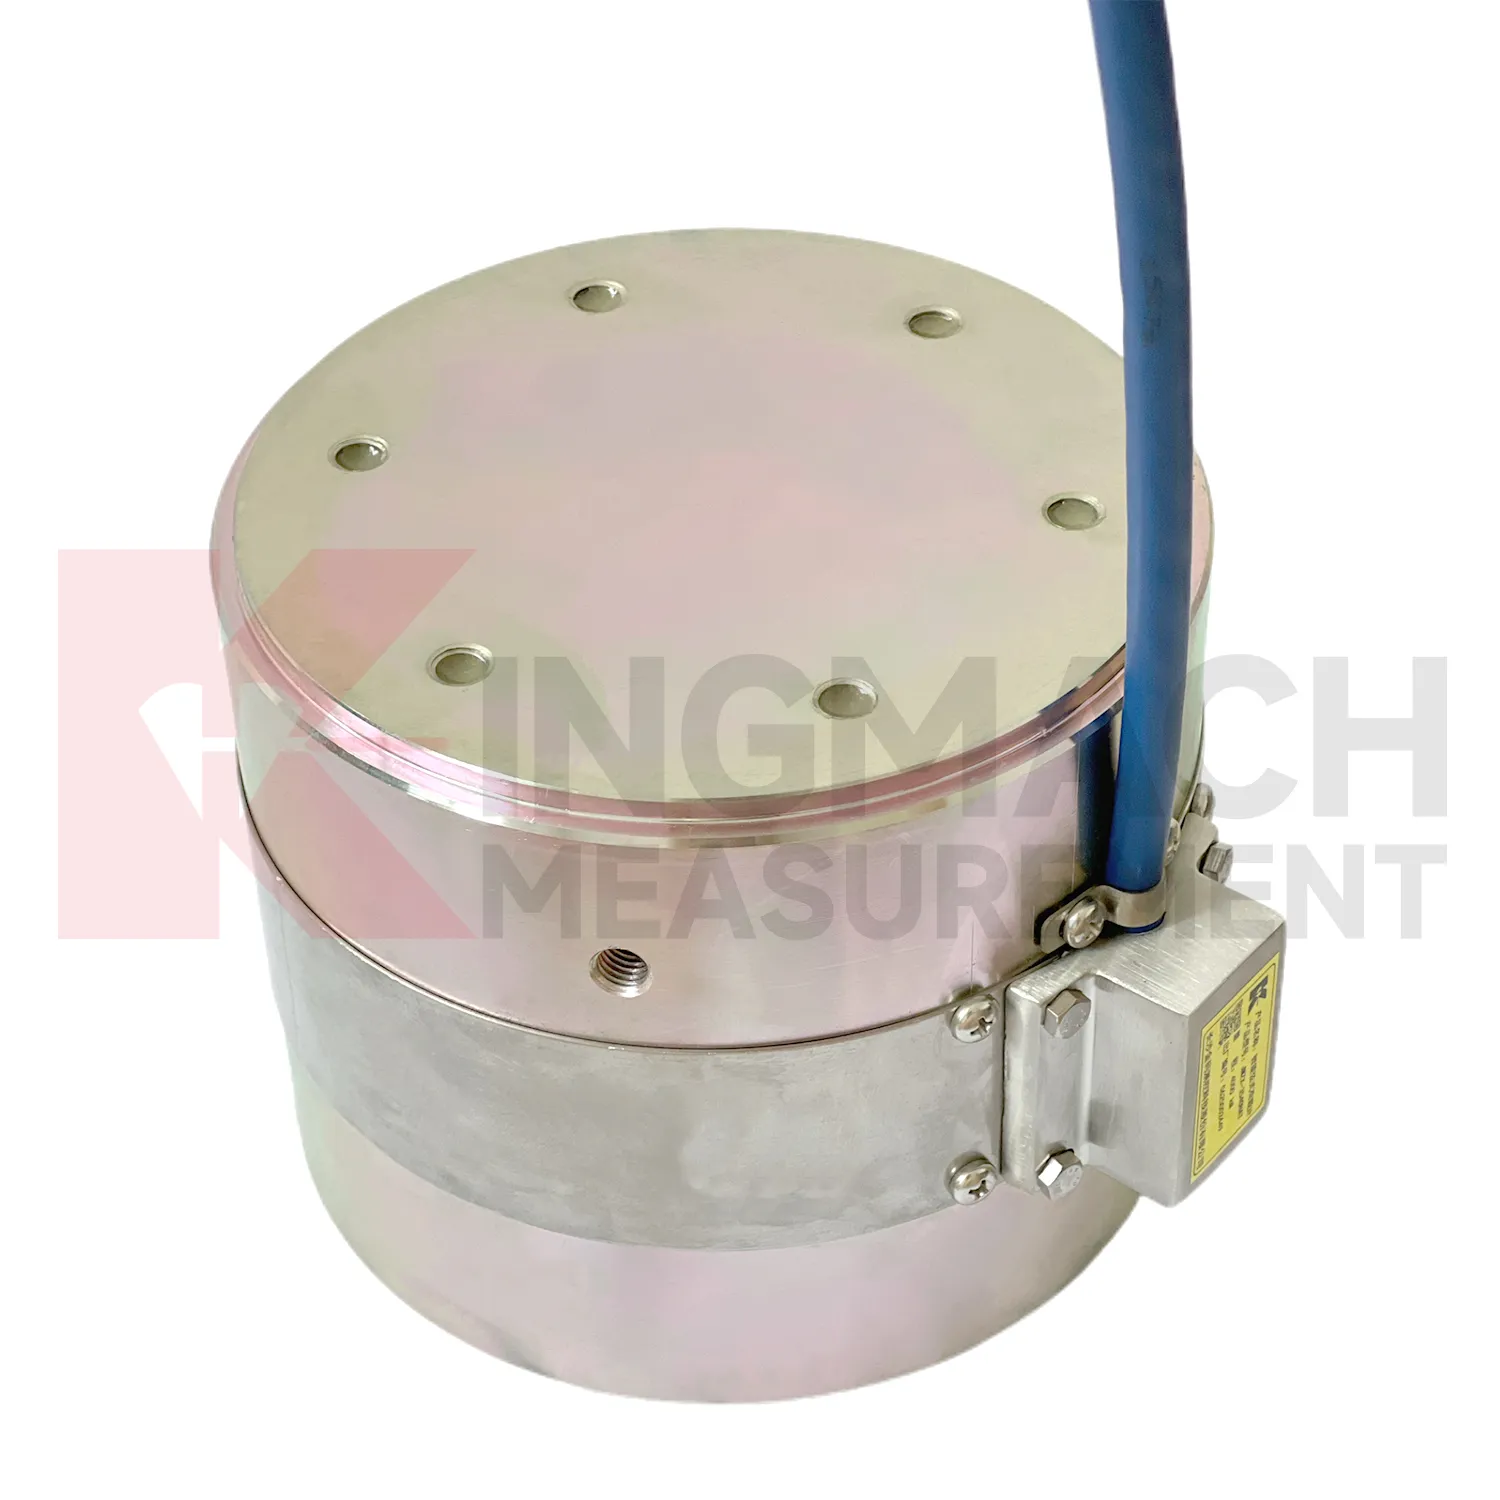
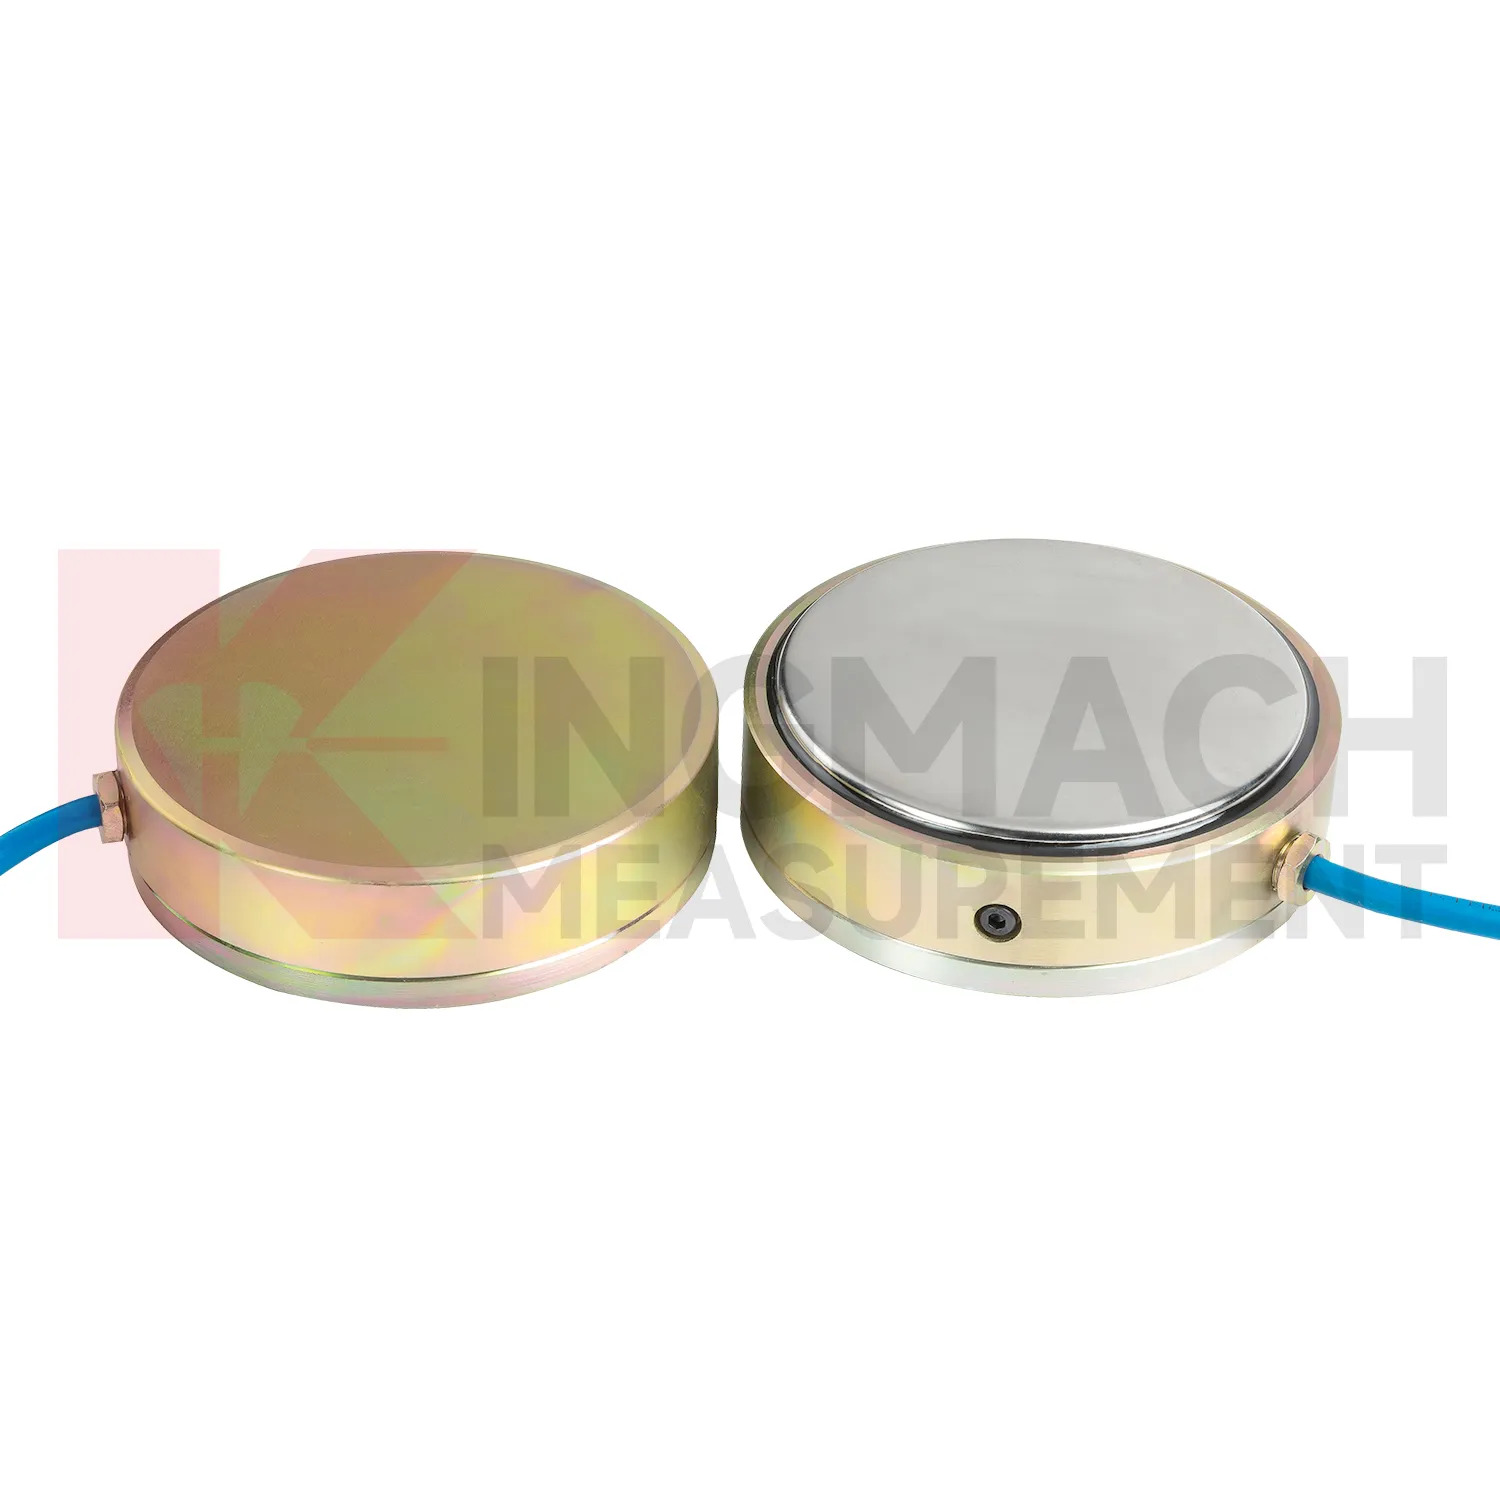
Kingmach load cell connection diagram can also include pressure related sensing where soil or structural contact pressure is the main concern. The JMZX-50XXAT/ATM earth pressure cell family is listed in 0.3 MPa, 0.6 MPa, 1 MPa, 2 MPa, 4 MPa, 6 MPa, and 8 MPa ranges, with 0.001 MPa pressure resolution, 0.5%FS pressure accuracy, and ±0.5°C temperature accuracy. The product information also refers to high strength elastic steel, waterproof and durable construction, a 50 year design life, 800 stored measurement sets, and automated acquisition support. For retaining structures, embankments, dams, tunnels, and foundation pits, those pressure records help engineers understand whether earth load, water influence, compaction, or excavation stage changes are affecting the structure. Kingmach's broader monitoring catalog allows these readings to be compared with settlement, water pressure, displacement, and tilt. That connection is important because pressure change without movement may still indicate a developing load redistribution that deserves closer inspection. The same site places these instruments within a wider monitoring range, including piezometers, water level meters, displacement transducers, settlement sensors, tiltmeters, cables, data loggers, and software. That wider range helps when a project needs force data to be compared with movement, water, and temperature records.
Application of load cell connection diagram
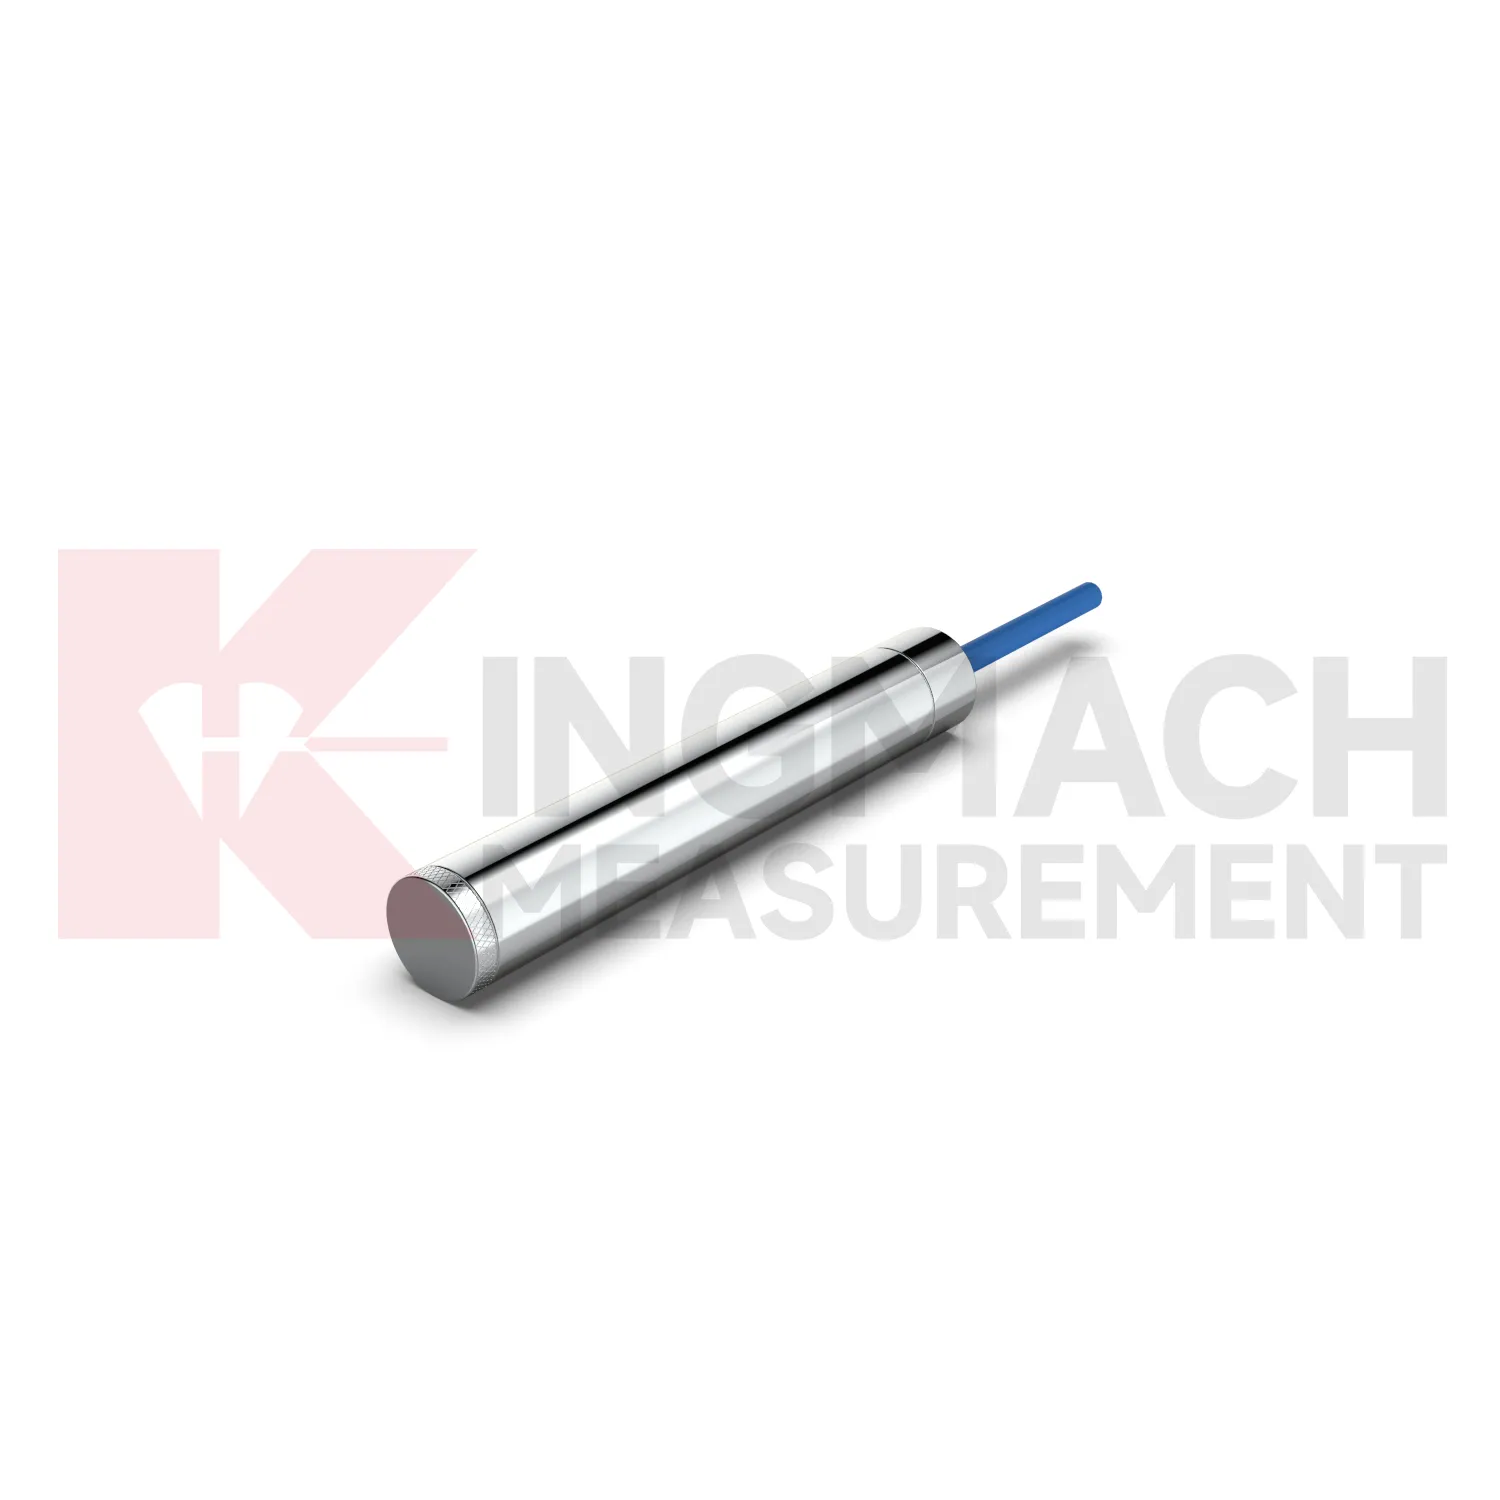
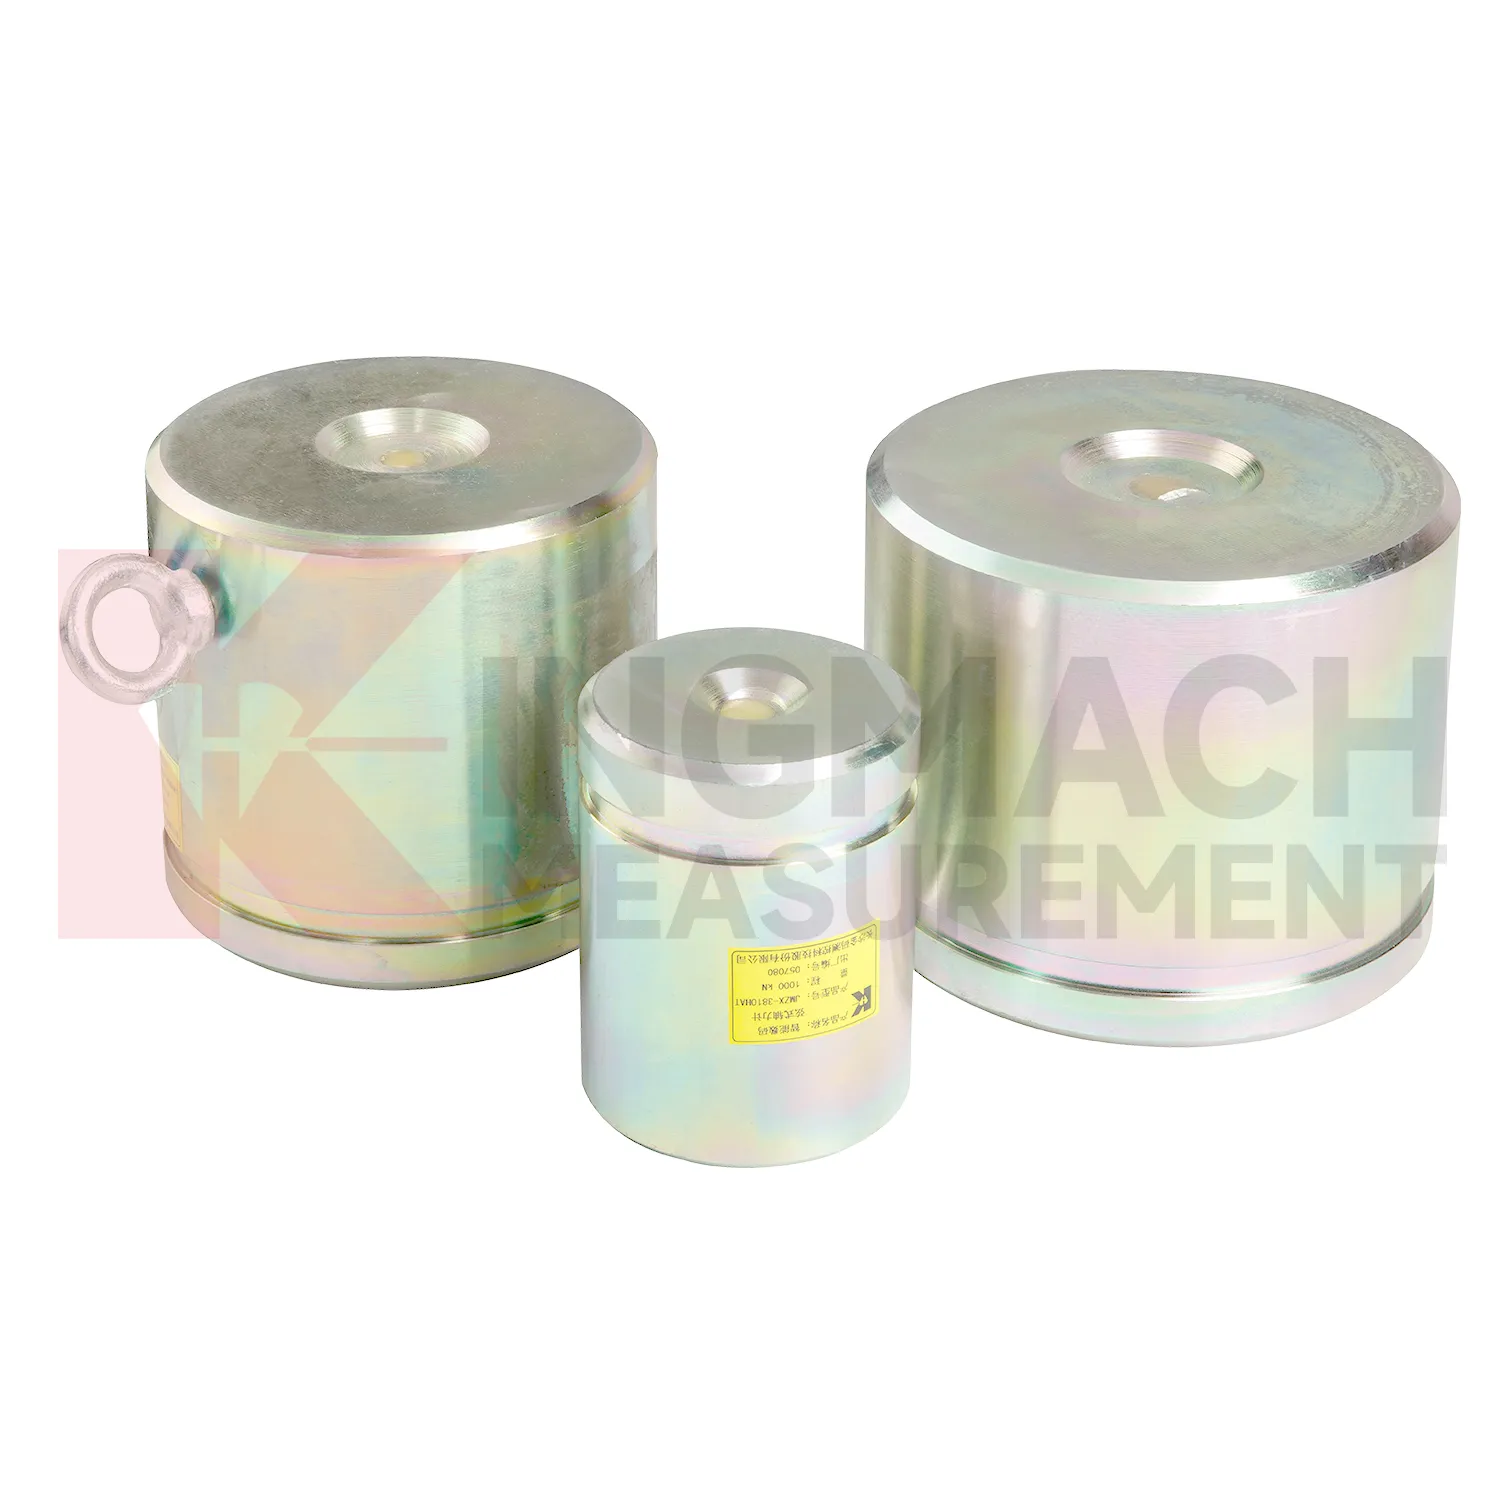
In pile load testing and bearing capacity verification, load cell connection diagram helps track applied force, load stages, unloading response, and residual behavior. The common problem is uncertainty around whether the applied load is centered and whether the recorded value matches the actual force passing through the test system. Kingmach solid load cells such as JMZX-35XXHAT list 1000 kN to 10000 kN ranges, 0.1 kN resolution, and 0.5%FS precision, with overload information listed as 20 to 50%F.S. range overload and 300 to 400%F.S. failure overload. These figures suit heavy test work when capacity margin must be checked before the sensor is installed. During the test, the record should include each loading step, hold time, unloading step, zero check, temperature, and any change to the bearing arrangement. Pairing the load record with settlement readings gives a clearer view of pile response. After the test, the documented calibration coefficient and instrument identity help keep the acceptance file defensible. Test reports should also record jack pressure, settlement response, load rate, hold duration, and any adjustment to the reaction system. These records help engineers identify whether an unusual load value came from the pile, the loading setup, or the measurement chain.
The future of load cell connection diagram
Future load cell connection diagram networks will need better alarm logic than fixed thresholds alone. A 5 percent force rise may be routine during concrete curing, serious during anchor relaxation, or irrelevant during a temperature swing. Kingmach products with temperature correction, stored records, digital output, and compatible data acquisition provide the raw structure for richer judgment. The next technical path is multi-parameter comparison: force plus displacement, pressure plus water level, support load plus excavation stage, cable force plus temperature. AI analysis can help rank unusual patterns, but the field team still needs plain evidence: which point changed, how fast, under what condition, and whether nearby sensors agree. Digital twin platforms can make that easier when sensor locations and calibration data are reliable. As monitoring specifications become more demanding, the instruments that win trust will be the ones that keep readings traceable from installation through maintenance, not just during the first acceptance test. Good metadata will matter as much as communication speed.
Care & Maintenance of load cell connection diagram
For load cell connection diagram used in pile load testing, care begins before the first load step. Confirm that the selected solid load cell range, often between 1000 kN and 10000 kN on Kingmach listed models, exceeds the planned test load with proper margin. Check the 0.1 kN resolution, 0.5%FS precision, calibration certificate, bearing plate flatness, and centering arrangement. During the test, protect the cable from jack movement and keep the readout position safe from vibration and water. Record zero value, temperature, load stage, hold time, unloading stage, and any pause or adjustment. After the test, inspect the sensor for dents, side load marks, connector damage, and cable jacket cuts. Store the calibration coefficient with the test report, not only with the instrument box. If later readings appear inconsistent, compare them with jack pressure, settlement data, and loading procedure before blaming the sensor. Store the report with the test file.
Kingmach load cell connection diagram
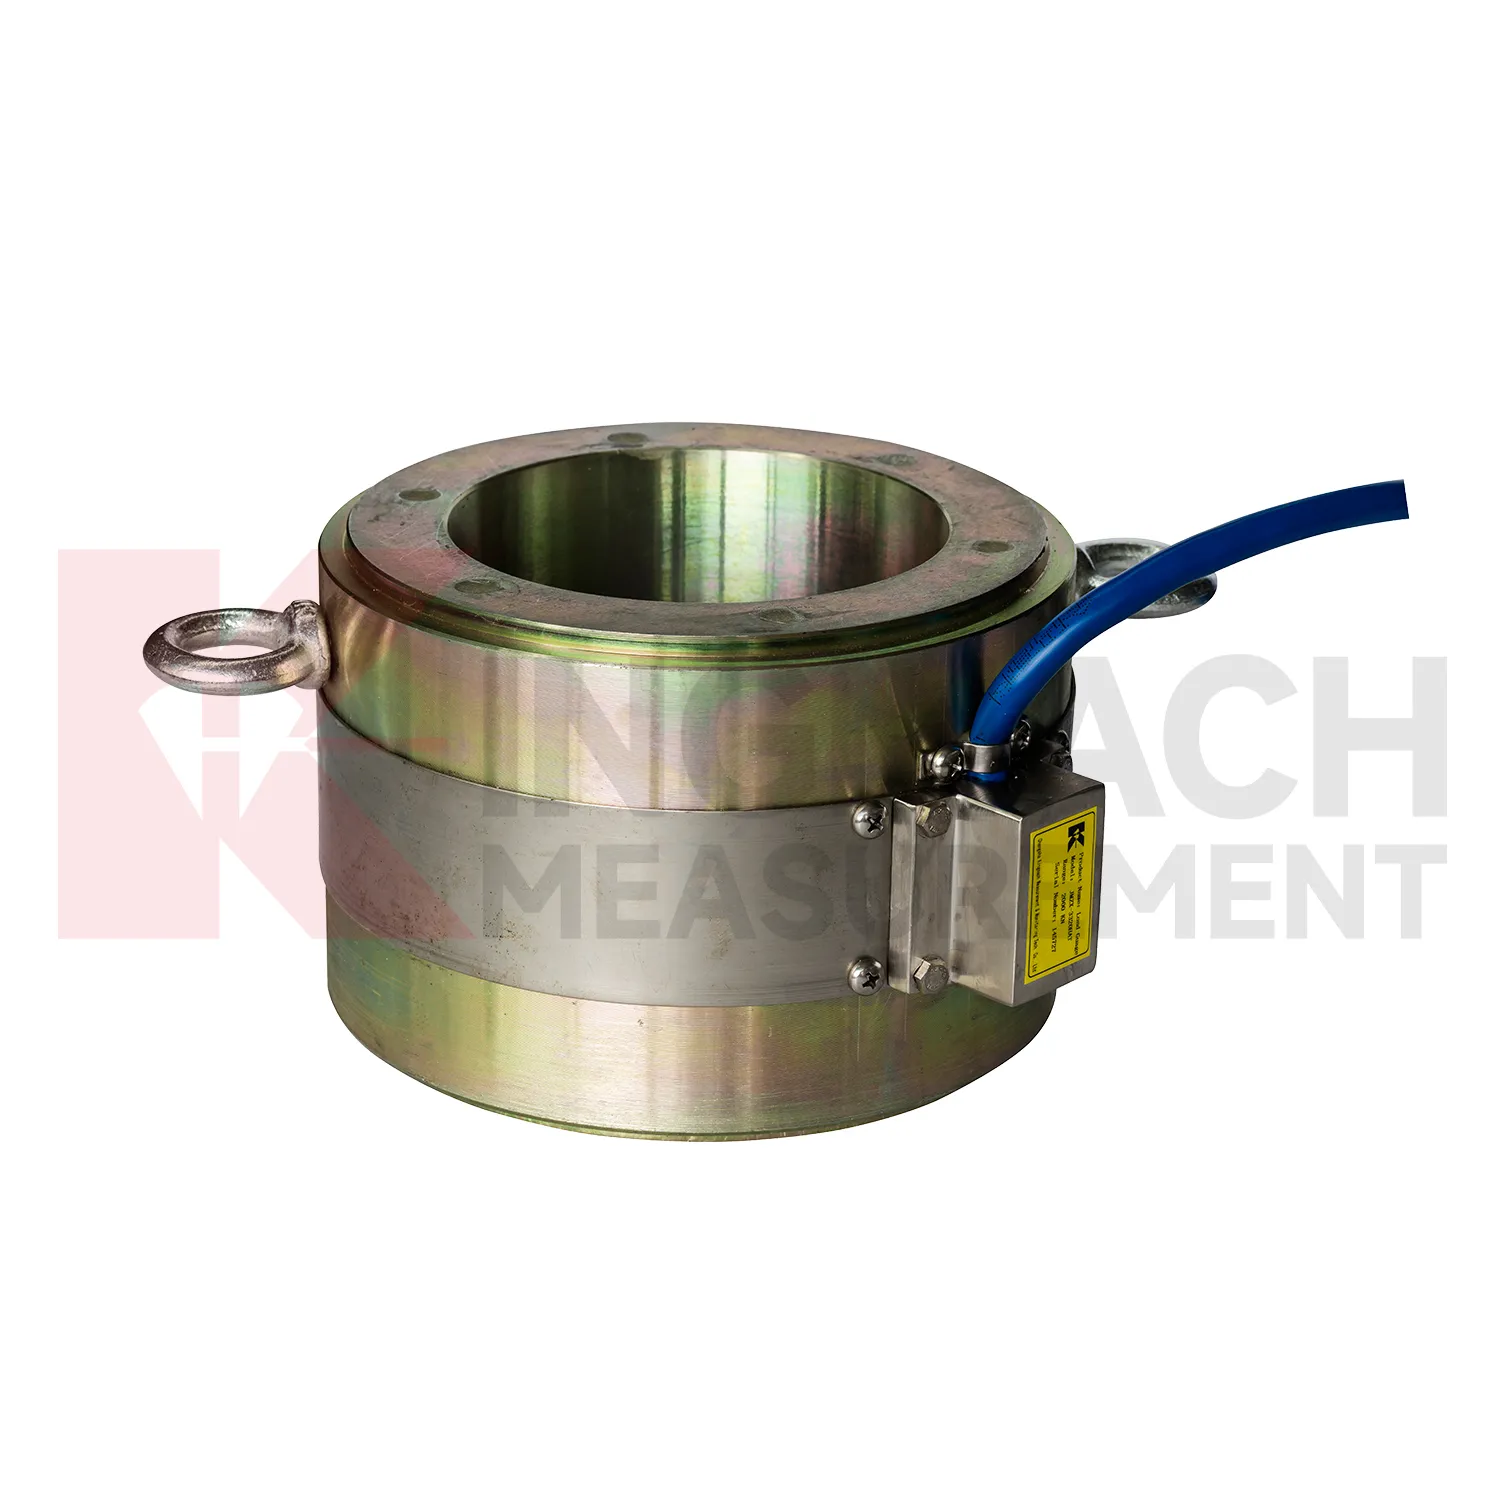
load cell connection diagram can be treated as a field witness for hidden force transfer in civil structures. Concrete, steel, soil, cable systems, and hydraulic loading may all look calm while the internal load path changes. Kingmach products in this category cover hollow load cells for anchors and cables, solid load cells for compression and pile testing, axial force meters for steel support loads, and earth pressure cells for contact pressure. Each type answers a different site question. Has the anchor lost tension? Is a pile test load centered? Is an excavation support taking more force after the next soil layer is removed? Is water pressure pushing the retaining structure harder after rain? The strongest monitoring records combine the sensor model, calibrated coefficient, zero value, temperature, reading time, and construction stage. That record gives owners a way to compare today with last week, last season, or the previous loading step, instead of relying on a single inspection note.
FAQ
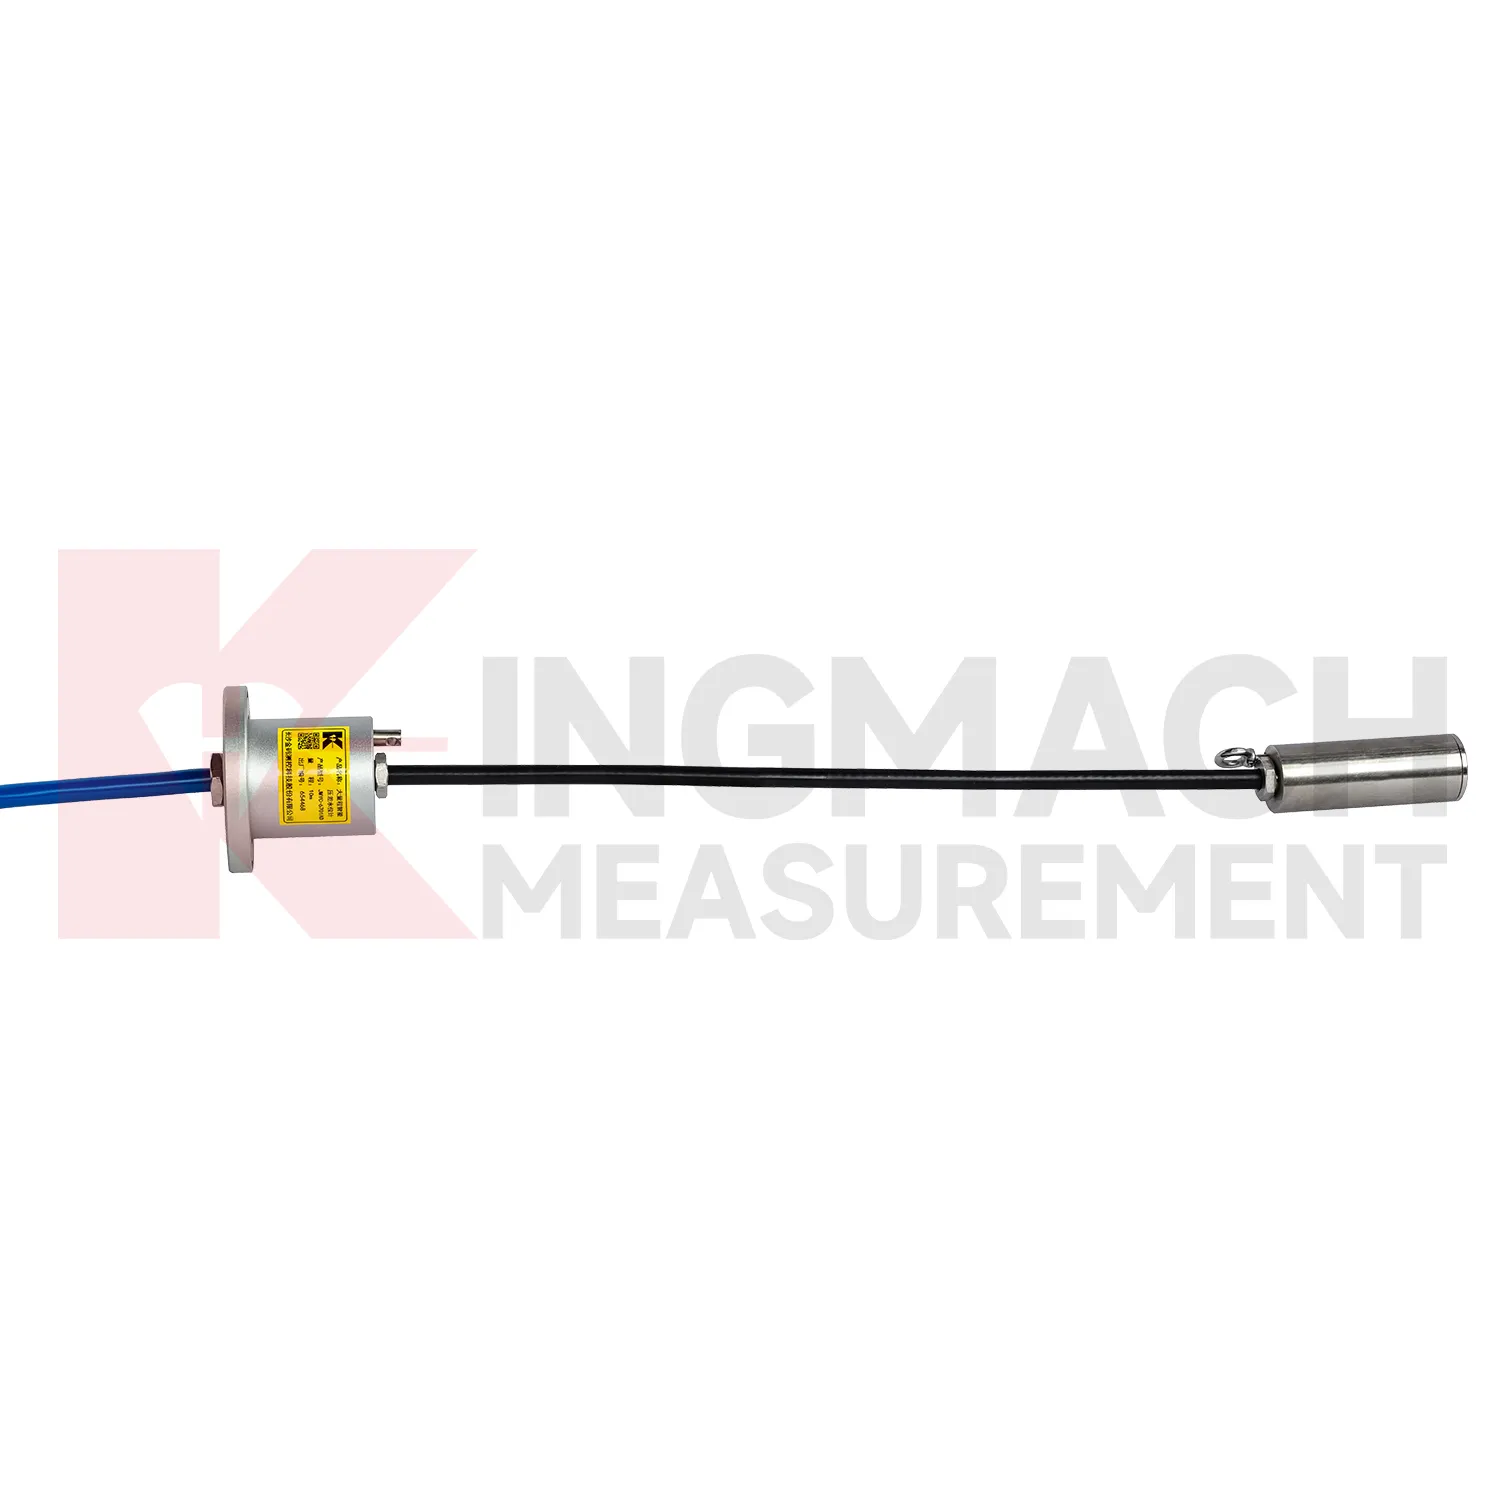
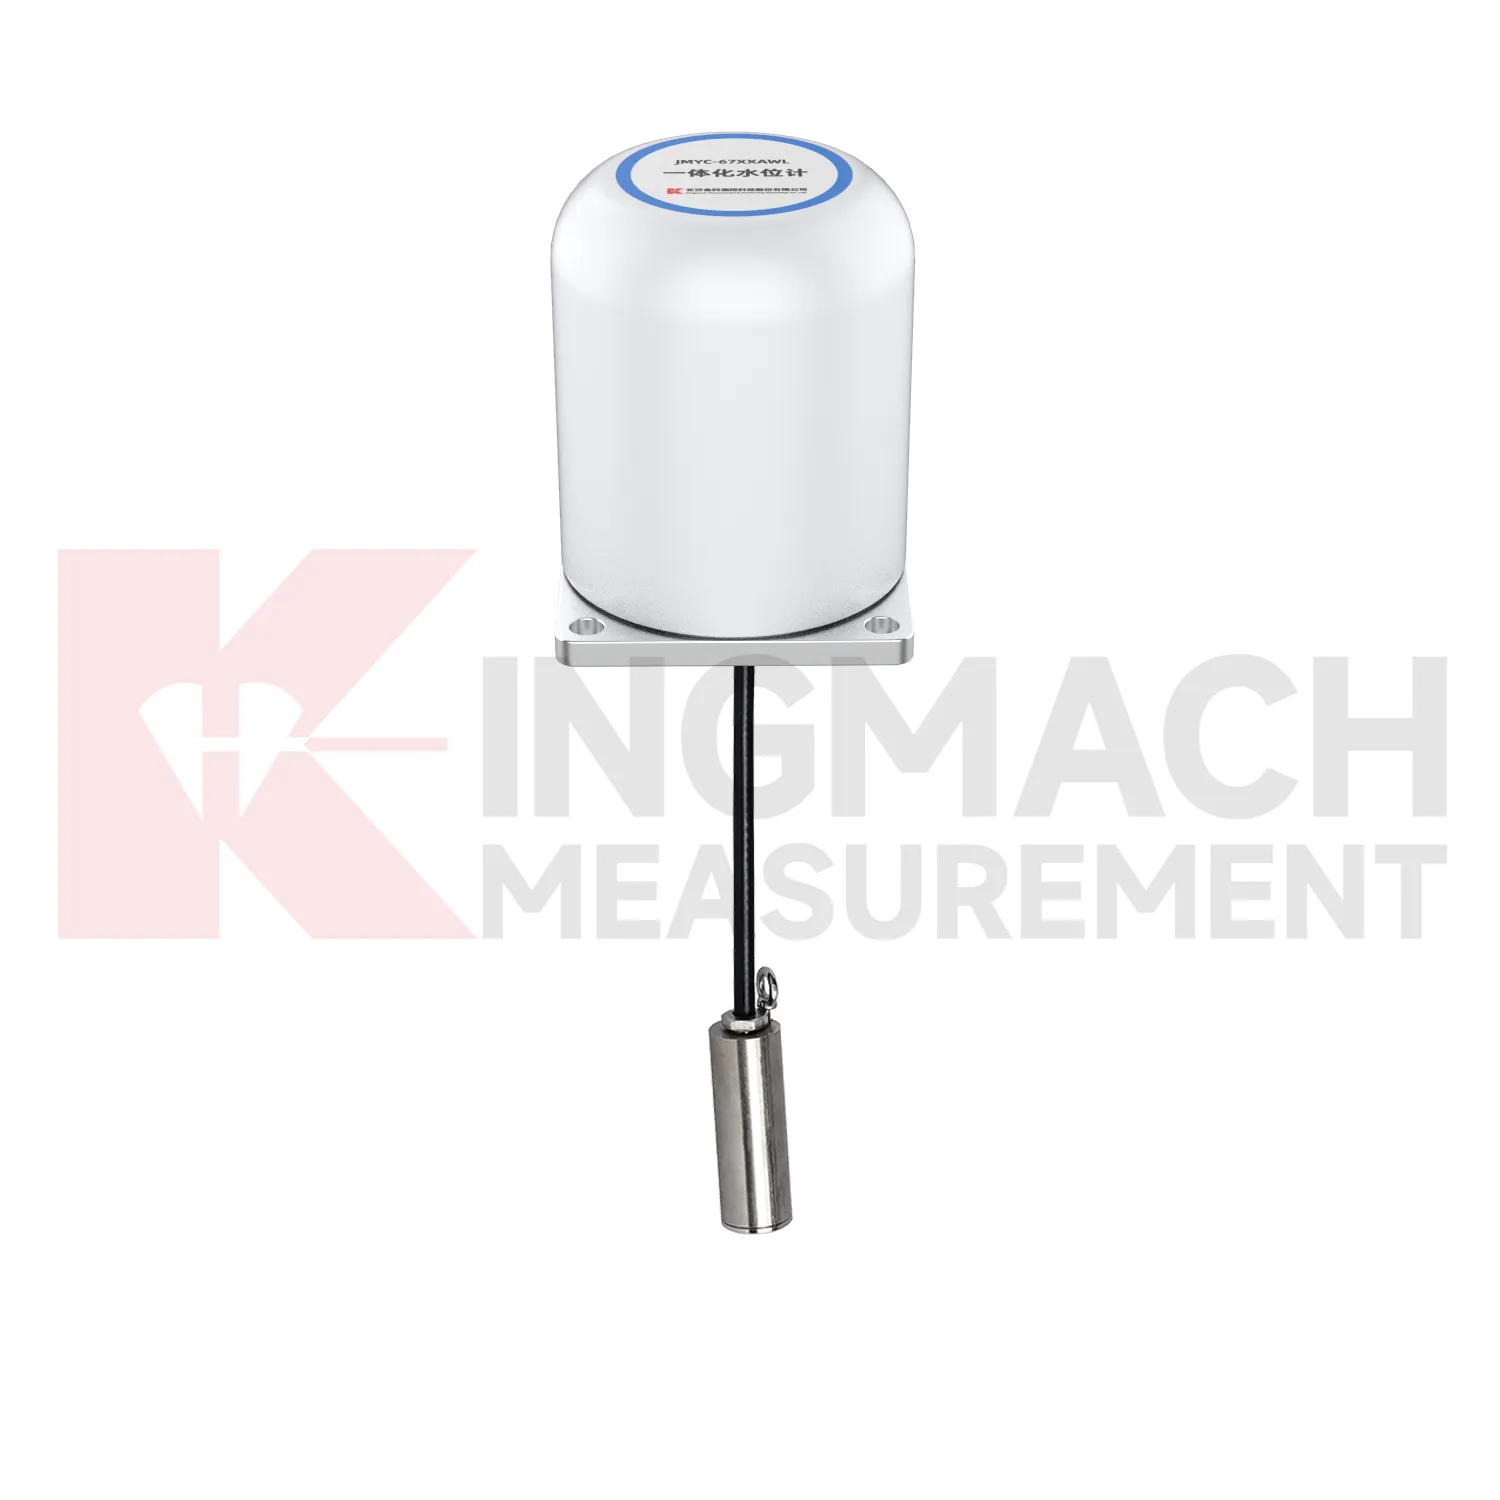
Q: How should load cell connection diagram be selected for a bridge cable or anchor point? A: Start with expected force, lock-off load, possible overload, bearing geometry, and access for later inspection. Hollow load cells are commonly used where the anchor or cable passes through the center opening. Q: What range information is available from Kingmach hollow models? A: The JMZX-3XXXHAT series is listed from 500 kN to 8000 kN, with 0.1 kN sensitivity on the 500 kN model and 1 kN on larger listed models. Q: Why does temperature correction matter? A: Cable and anchor readings can move with temperature, so built-in temperature measurement helps reduce false interpretation. Q: Can readings be stored inside the sensor? A: Smart hollow models list storage for 800 measurement records, including time, temperature, zero values, and correction data. Q: What should be checked after installation? A: Check seating, cable protection, connector sealing, zero value, first stable force, and matching channel name.
Reviews
Christopher Martinez
Very satisfied with the readouts & data loggers. User-friendly interface and supports multiple sensor inputs.
James Thompson
The tiltmeters and accelerometers are very sensitive and provide precise data. Perfect for our structural health monitoring system.
Latest Inquiries
To protect the privacy of our buyers, only public service email domains like Gmail, Yahoo, and MSN will be displayed. Additionally, only a limited portion of the inquiry content will be shown.
Evelyn***@gmail.comSouth Africa
Hi, we are a contractor working on tunnel construction and need settlement sensors and displacement ...
Amelia***@gmail.comSingapore
Hello, I am looking for visualization software for monitoring system data analysis. Please let me kn...