 ar
ar bg
bg hr
hr cs
cs da
da nl
nl fi
fi fr
fr de
de el
el hi
hi it
it ko
ko no
no pl
pl pt
pt ro
ro ru
ru es
es sv
sv tl
tl iw
iw id
id lv
lv lt
lt sr
sr sk
sk sl
sl uk
uk vi
vi et
et hu
hu th
th tr
tr fa
fa ms
ms hy
hy ka
ka ur
ur bn
bn mn
mn ta
ta kk
kk uz
uz ku
ku
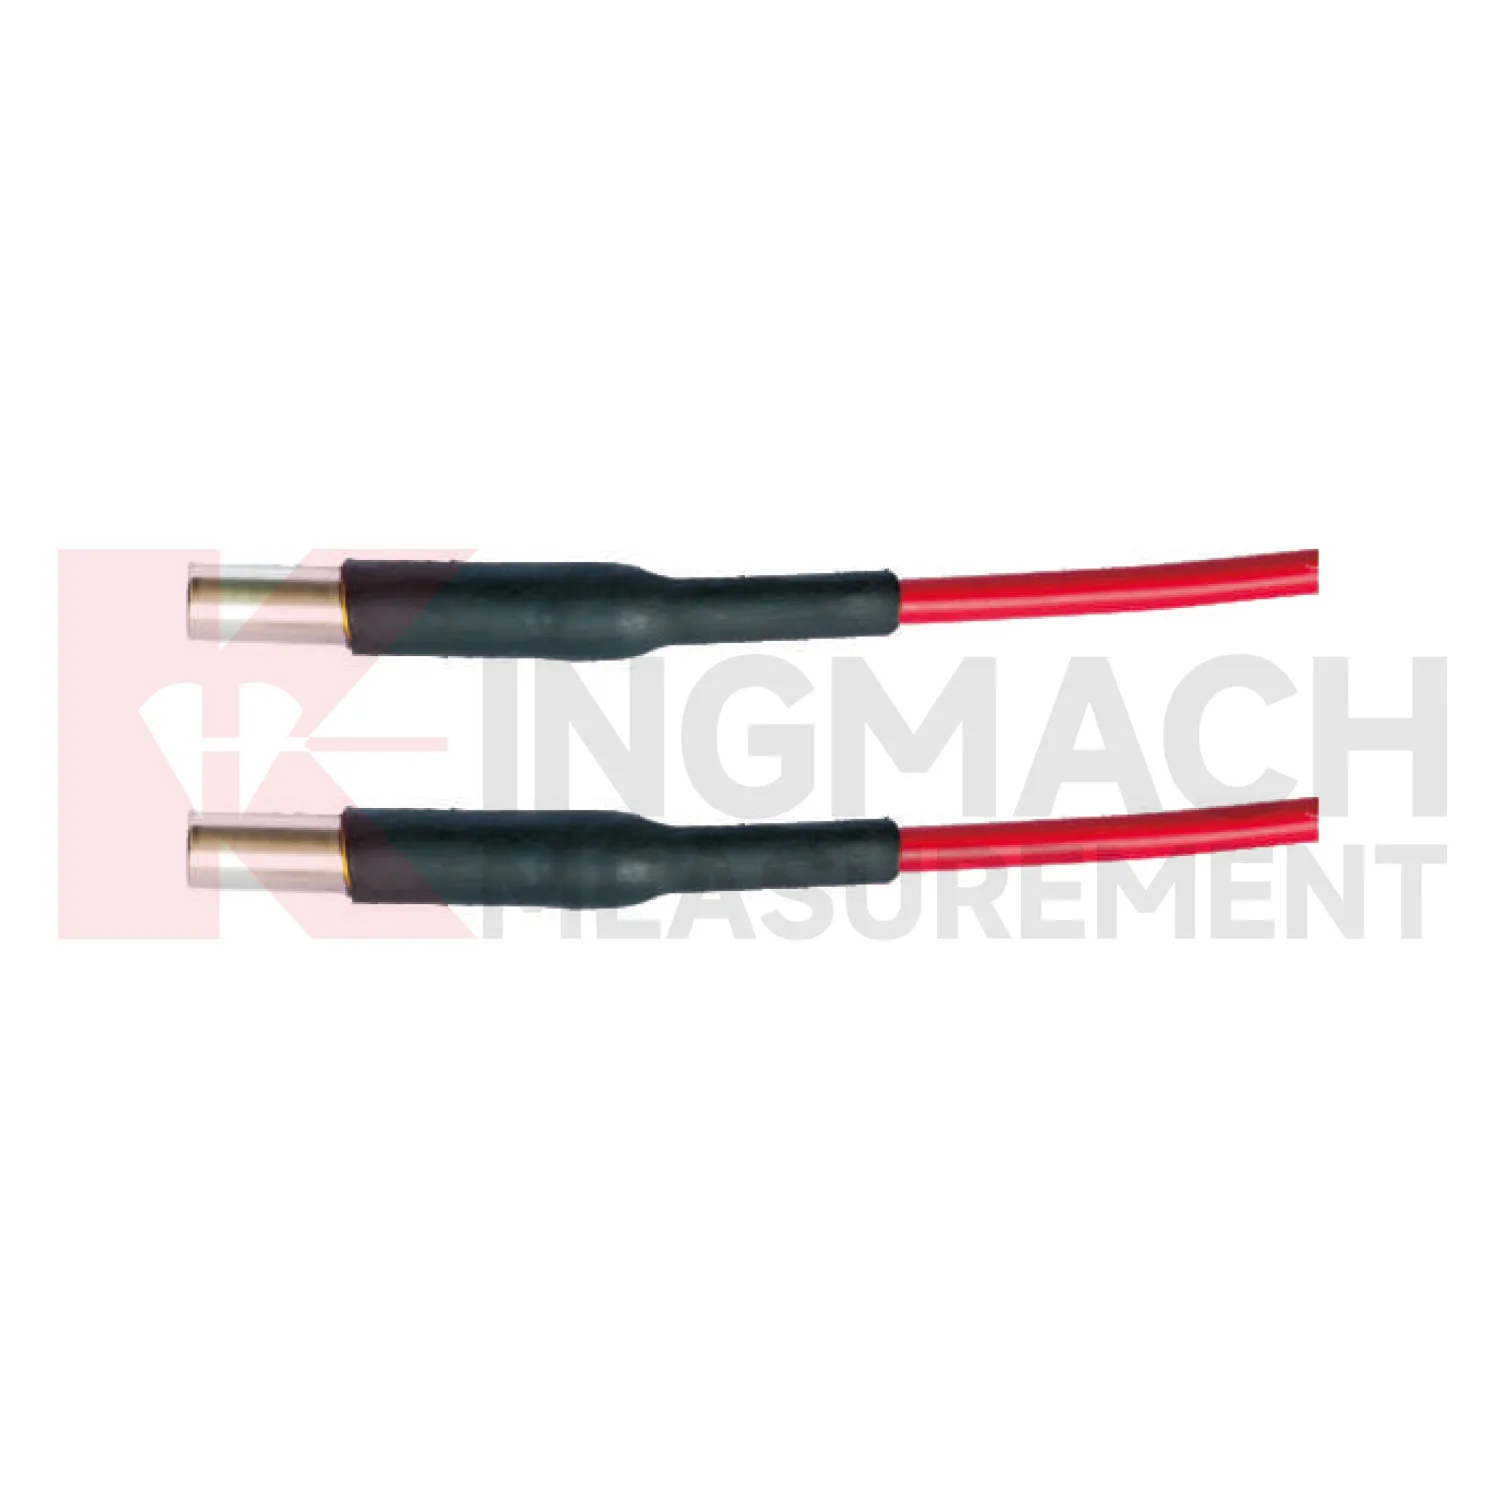
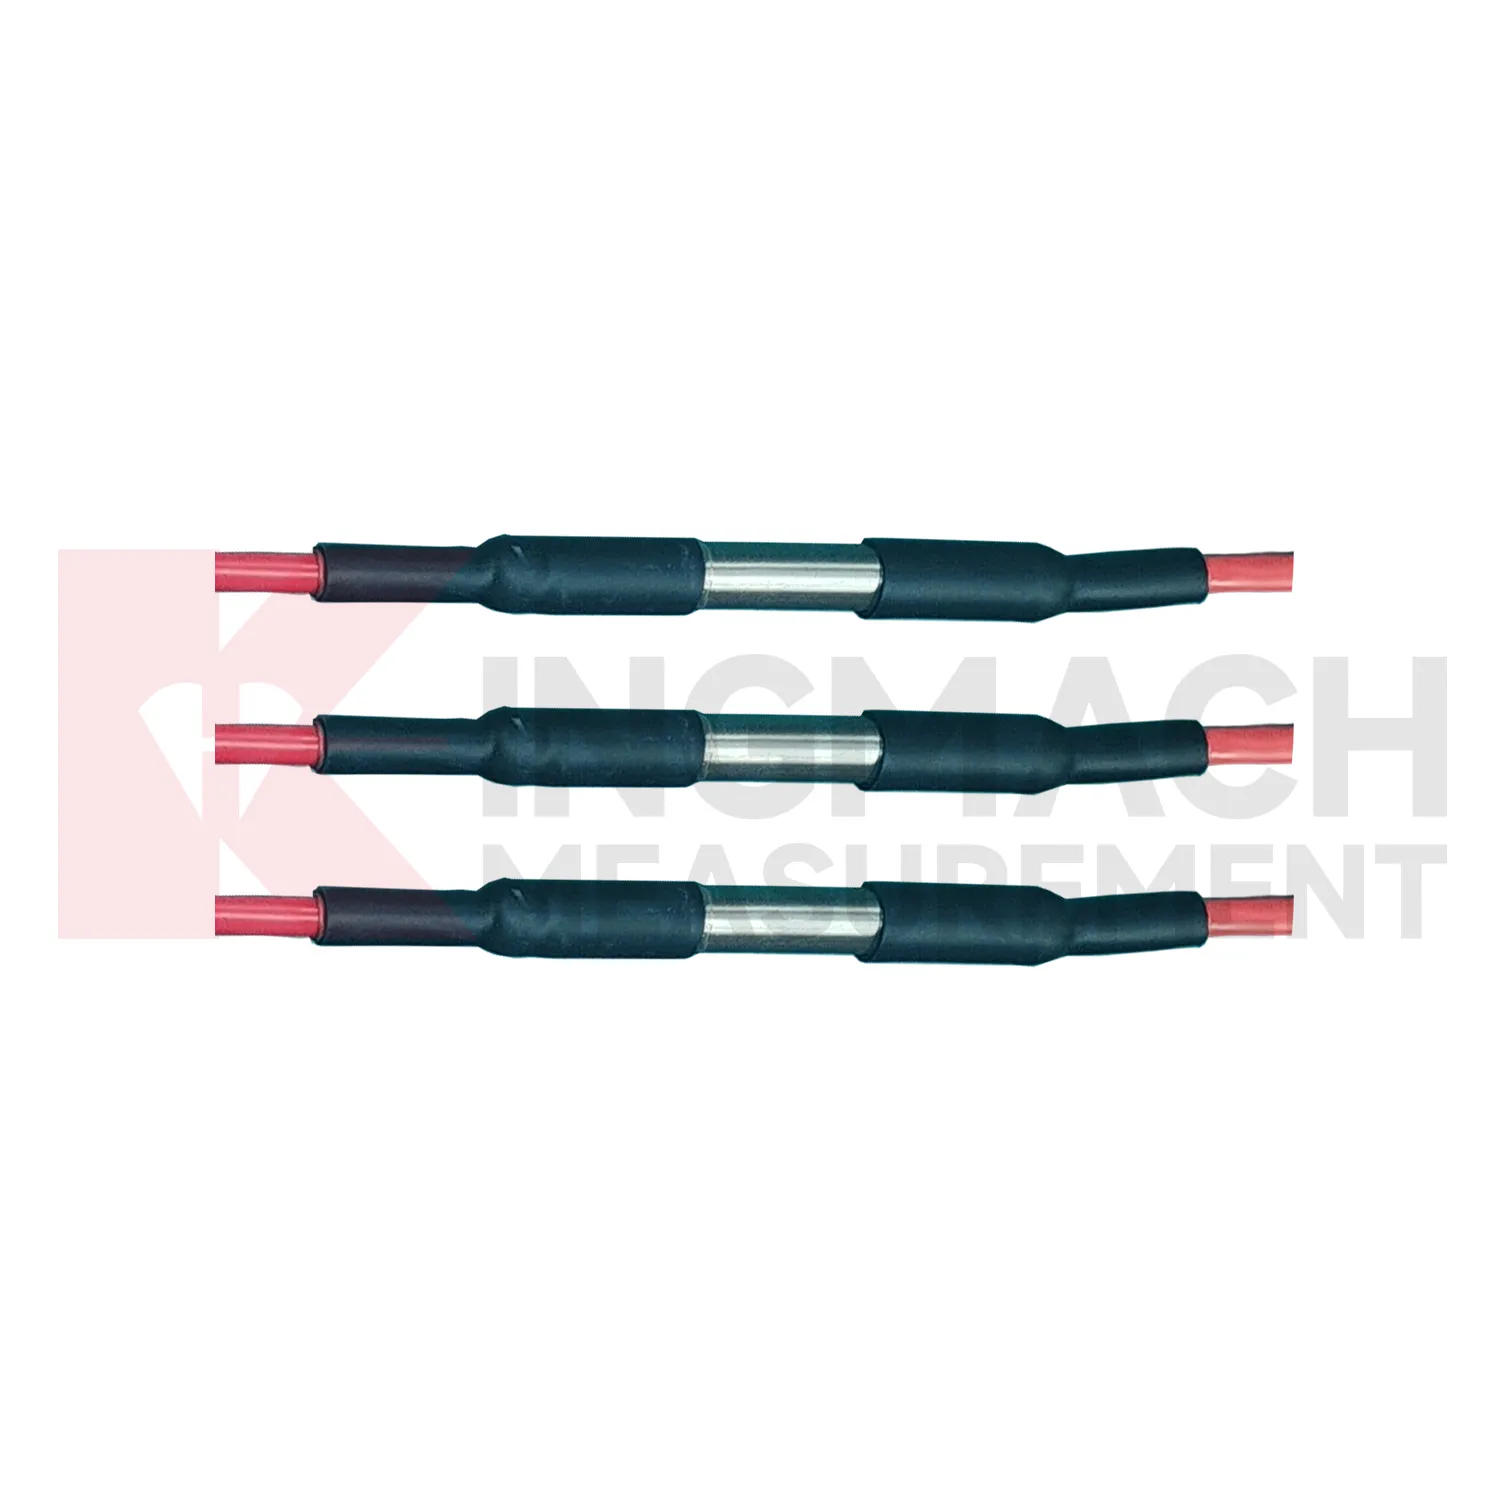
tipping bucket rain gauge data logger
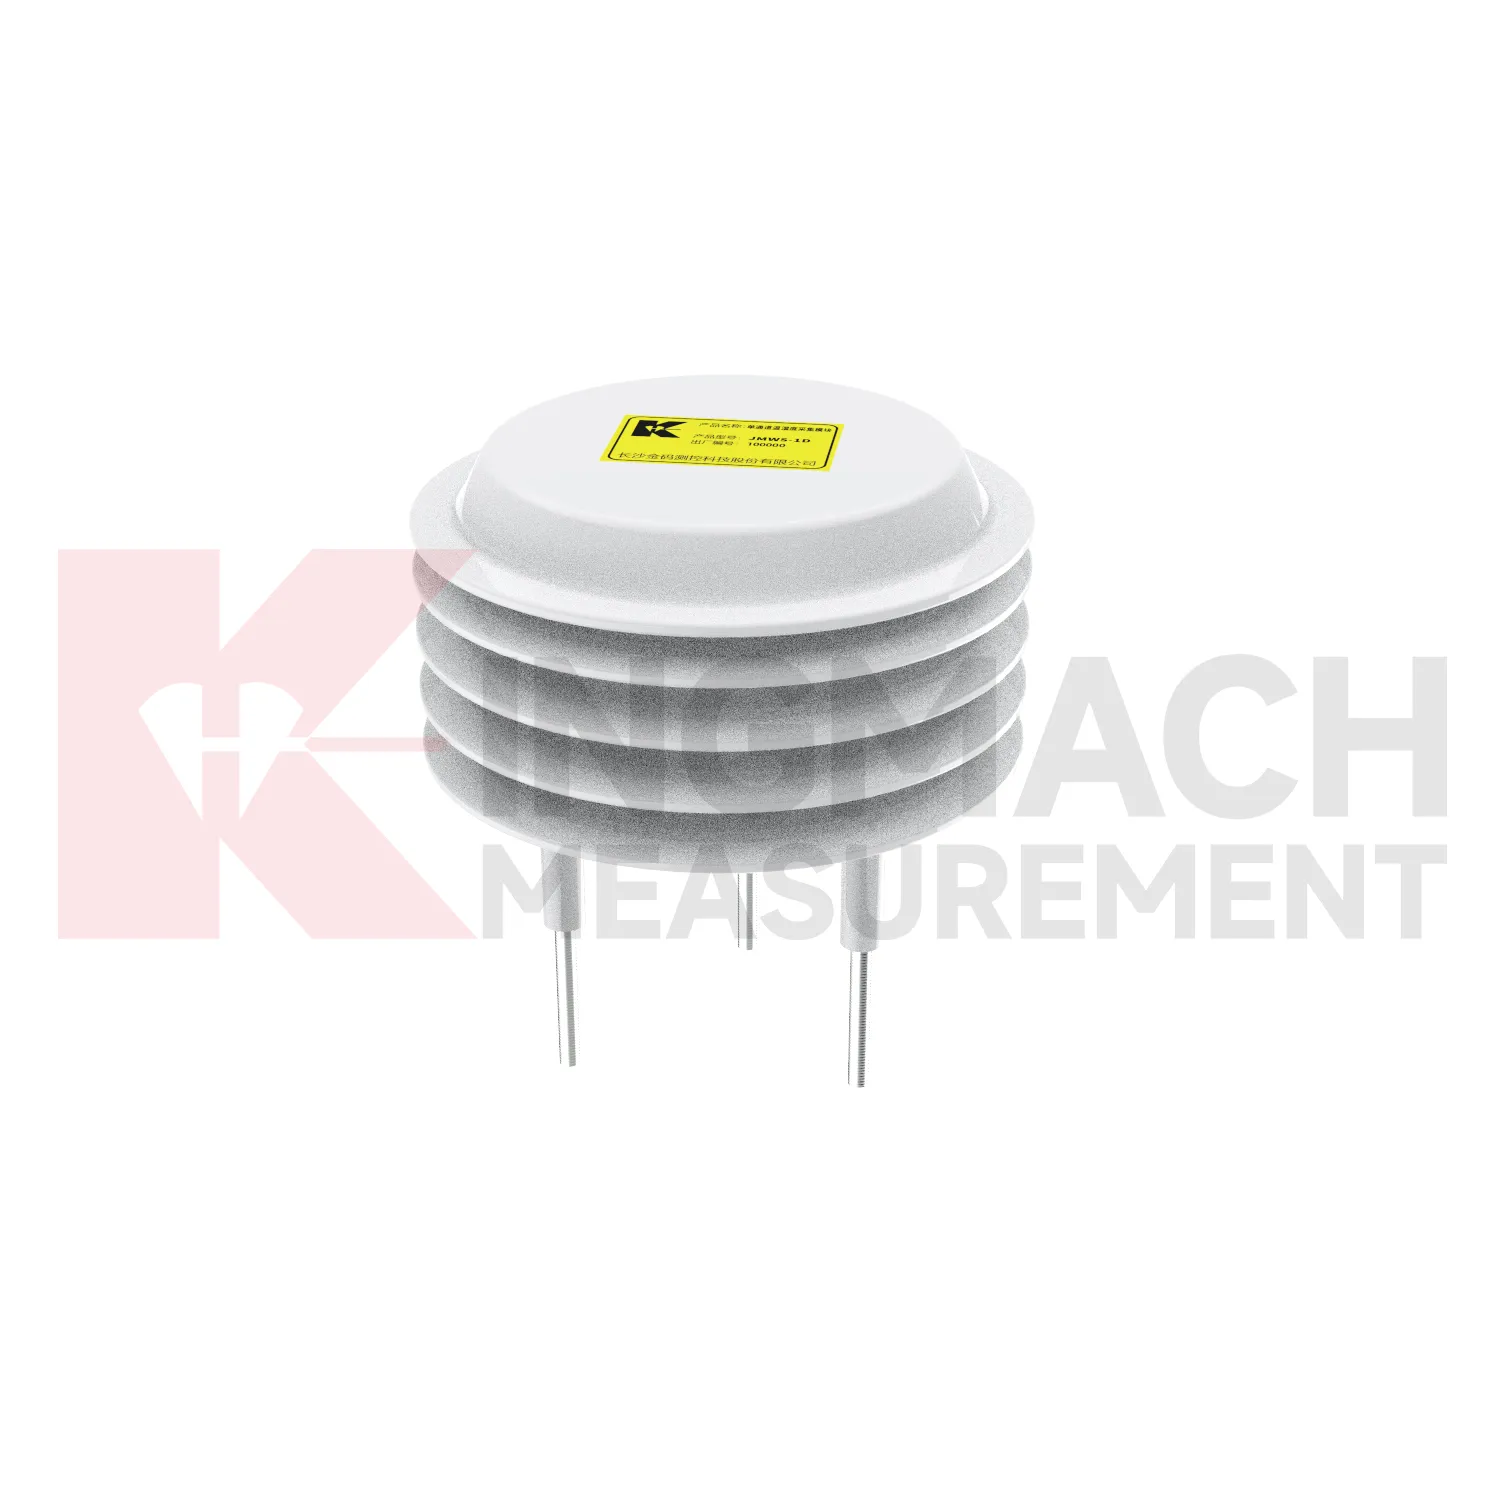
Kingmach tipping bucket rain gauge data logger covers the site-condition layer of structural and geotechnical monitoring. It records the environmental forces and operating conditions that often explain why a structural sensor changes. Rainfall can precede slope movement or seepage; soil wetness can show whether water has reached a sensitive layer; temperature can affect strain, expansion, and sensor behavior; humidity can reveal cabinet and tunnel risks; wind can explain vibration, pressure, and access constraints. A useful description of this category should therefore start with the monitoring problem. The equipment is not installed to fill a dashboard with weather values. It is installed so engineers can compare conditions with settlement, displacement, tilt, load, vibration, strain, inspection notes, and maintenance actions. When these records share time stamps and point names, the owner can see both the trigger and the response. That makes abnormal-event review faster and helps long-term reports distinguish seasonal patterns from real deterioration.
If the reading seems unusual, the team should check the physical condition of the station before drawing conclusions about the asset. Blockage, poor exposure, loose wiring, water entry, and changed surroundings can all create misleading patterns.
A practical report links the condition value with time, place, and action. It should help a reviewer decide whether to keep observing, inspect the field point, compare nearby instruments, or record the event as normal site behavior.

Application of tipping bucket rain gauge data logger
Tunnel and subway projects use Kingmach tipping bucket rain gauge data logger to follow underground air conditions, water-related changes, and equipment environments. Temperature and humidity can affect cabinet reliability, corrosion risk, sensor stability, and worker comfort. Rainfall outside a portal may relate to seepage or slope movement near entrances. Airflow or pressure differences can matter in shafts, stations, equipment rooms, and construction zones. Environmental readings should be reviewed with settlement, convergence, displacement, crack records, water-level observations, and maintenance notes. Point naming is especially important underground because many sections look similar after construction. A useful record includes chainage, side, elevation, equipment area, and sensor purpose. When a fault, leak, or deformation appears, environmental data helps the team understand whether the change followed weather, ventilation, construction, or equipment operation.
Underground maintenance teams also need environmental records that point to access reality. A damp equipment room, a warm cabinet zone, a portal affected by rain, and a ventilated platform area may all belong to the same project but require different responses. The report should keep these areas separate.
For handover, tunnel records should preserve section drawings, cabinet names, drainage notes, ventilation changes, and photographs after installation. This helps future teams know whether a humidity or temperature change came from site operation, water entry, seasonal weather, or equipment relocation.
The future of tipping bucket rain gauge data logger
Maintenance analytics will shape future Kingmach tipping bucket rain gauge data logger. A rain point can clog, a soil point can lose contact, a wind point can become sheltered by new equipment, and a humidity point can be affected by cabinet changes. Future platforms can flag flatlines, impossible jumps, missing intervals, and disagreement between related channels. These checks will not replace field inspection, but they will tell teams where to look first. This is especially useful on large projects with many stations. Data quality alerts help prevent months of unreliable environmental records from being accepted as real site behavior.
The maintenance view should be different from the engineering alarm view. It should show station health, last inspection, cleaning history, power condition, enclosure status, and whether nearby site changes may have altered exposure. That helps field crews prioritize practical work before data quality falls.
Over time, maintenance analytics can reveal weak points in the monitoring network itself. If one station repeatedly needs cleaning, loses communication, or disagrees with nearby conditions, the owner can decide whether to improve access, change protection, or move the point to a better location.
Care & Maintenance of tipping bucket rain gauge data logger
Data review is part of maintaining Kingmach tipping bucket rain gauge data logger. Look for impossible values, flatlines, repeated spikes, missing intervals, unit mistakes, and disagreement between related channels. Rainfall should have a plausible relation to wetting; wind pressure should be reviewed with wind exposure; humidity changes should match room or cabinet conditions. If a structural alarm occurs, environmental records should be checked before the team concludes that the structure changed. A good review compares time stamps, site events, maintenance logs, and nearby instruments. This habit keeps environmental records believable and turns them into a reliable part of engineering review.
Review work should also separate data-quality questions from engineering questions. A strange value may come from a blocked rain point, sheltered wind path, wet connector, moved cabinet, or changed unit setting. The reviewer should clear those possibilities before treating the record as a site condition.
Monthly checks can include a short data-quality note that lists missing intervals, unusual values, repaired points, and channels needing field inspection. This makes the environmental network easier to manage and keeps abnormal-event reports from being built on weak records.
Kingmach tipping bucket rain gauge data logger
Kingmach tipping bucket rain gauge data logger helps engineering teams read the conditions around a structure before they judge the structure itself. Temperature, humidity, rainfall, wind, pressure, and soil wetness can all change how bridges, tunnels, slopes, buildings, dams, and construction sites behave. A deformation curve after a storm is different from the same curve during a dry week. A strain record during a heat wave needs a temperature background. A cabinet fault in a tunnel may have more to do with moisture than with the instrument connected to it. The purpose of this category is to make those surrounding conditions visible. When environmental records sit beside settlement, displacement, tilt, load, vibration, and inspection notes, engineers can explain why a reading changed instead of only seeing that it changed.
For field teams, this point is most useful when the record shows the condition before the structural response, during the response, and after the site returns to routine operation. The note should include weather timing, inspection access, nearby construction, and whether the linked structural points changed in the same period.
FAQ
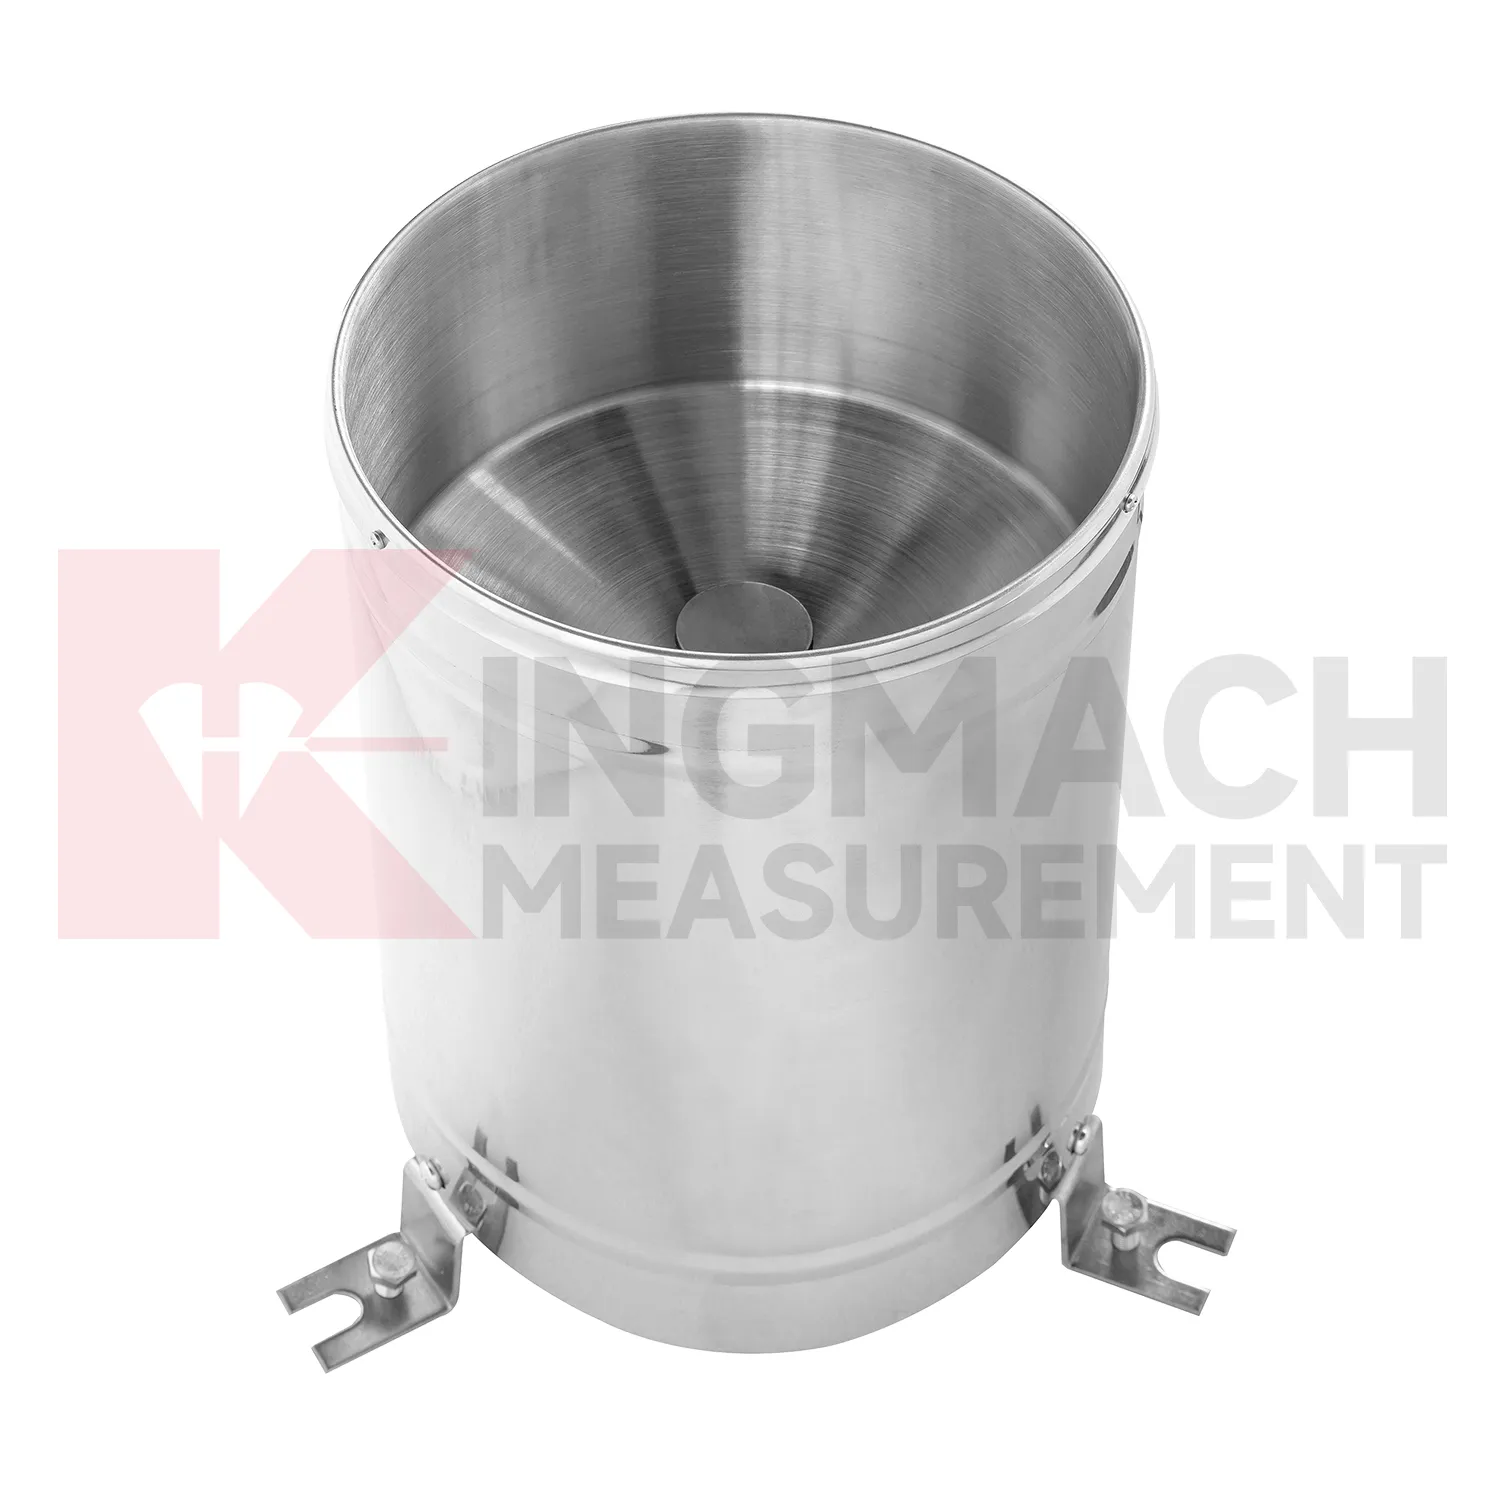
Q: Where should a rain point be placed?
A: It should be level, open to the sky, and away from obstructions, splash sources, roof edges, and debris-prone areas.
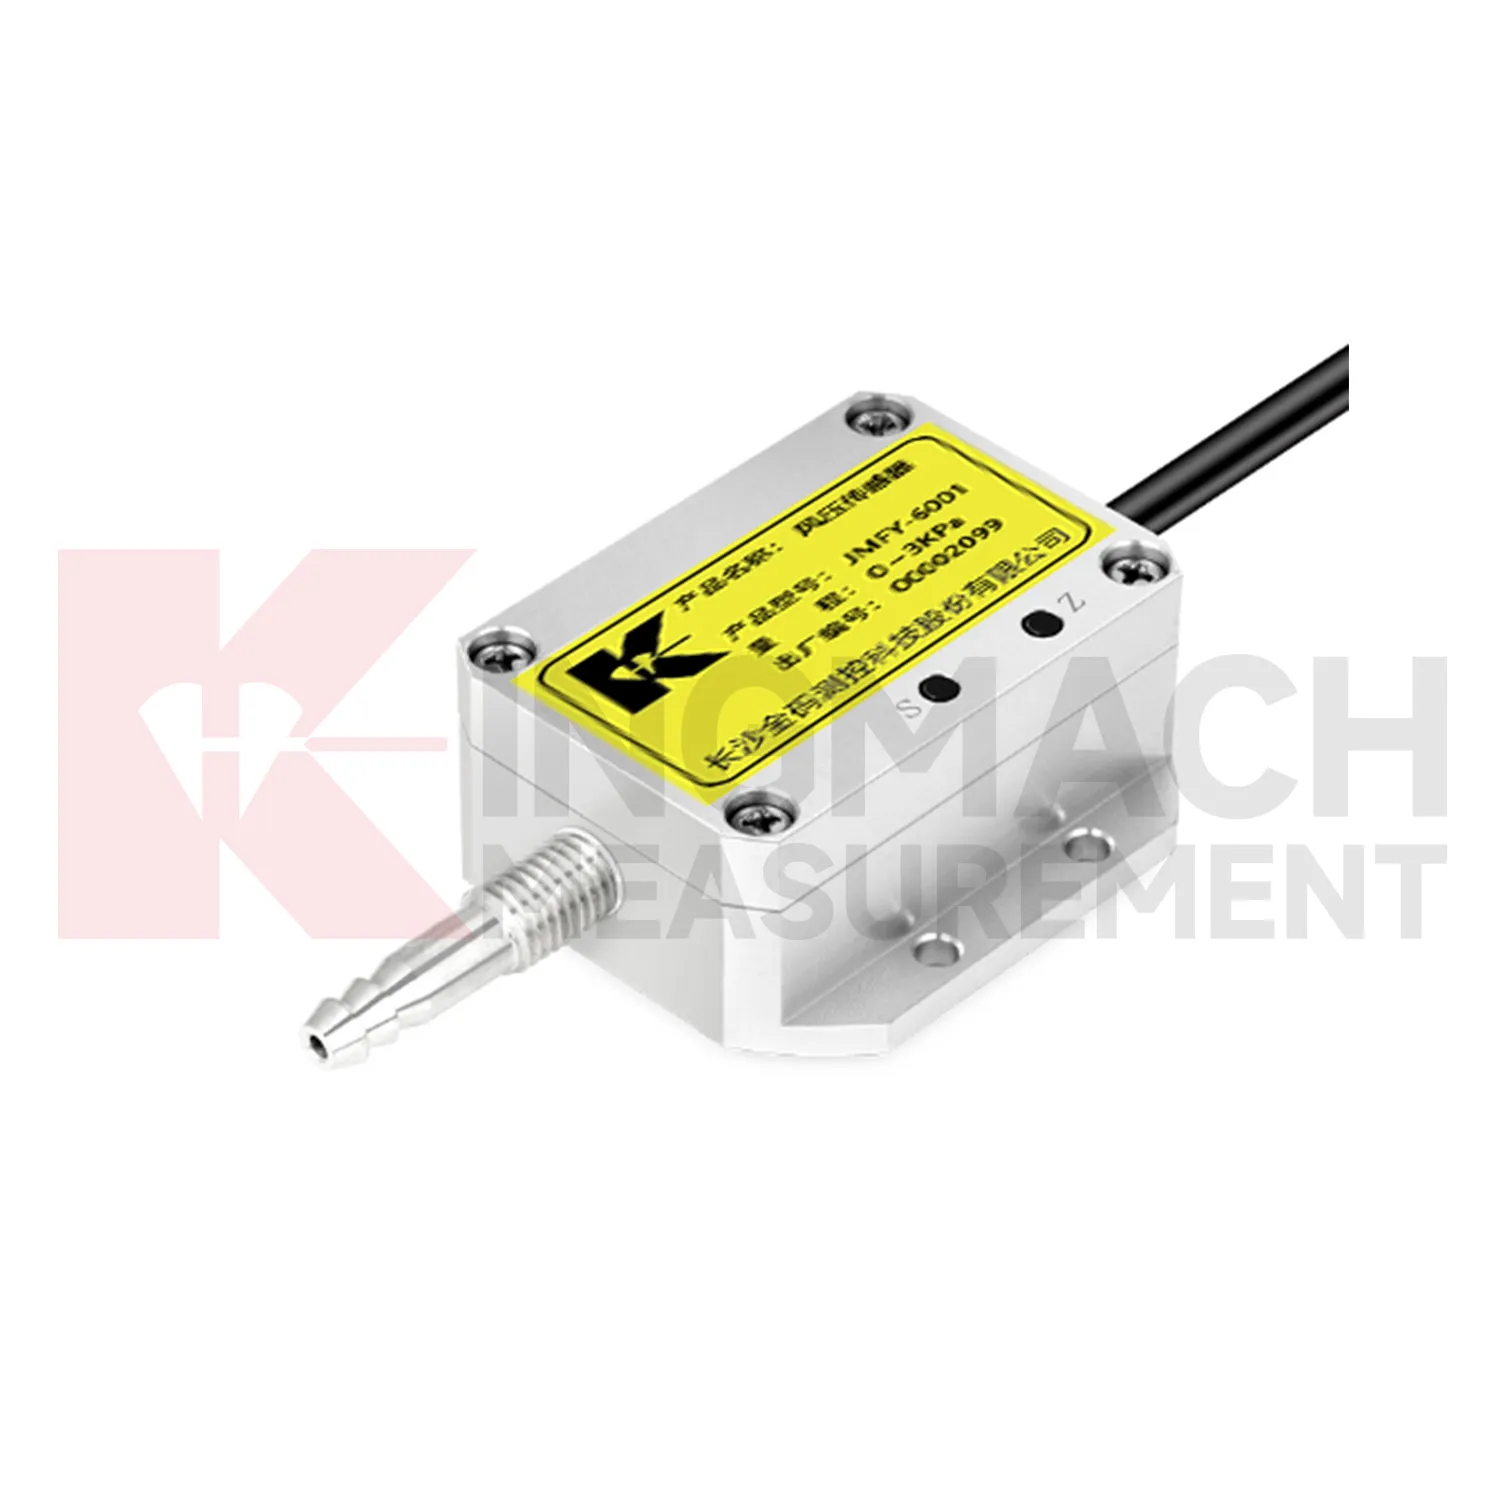
Q: Where should wind be measured?
A: Wind should be measured where airflow represents the asset or work area being reviewed, not behind a wall or sheltered obstruction.
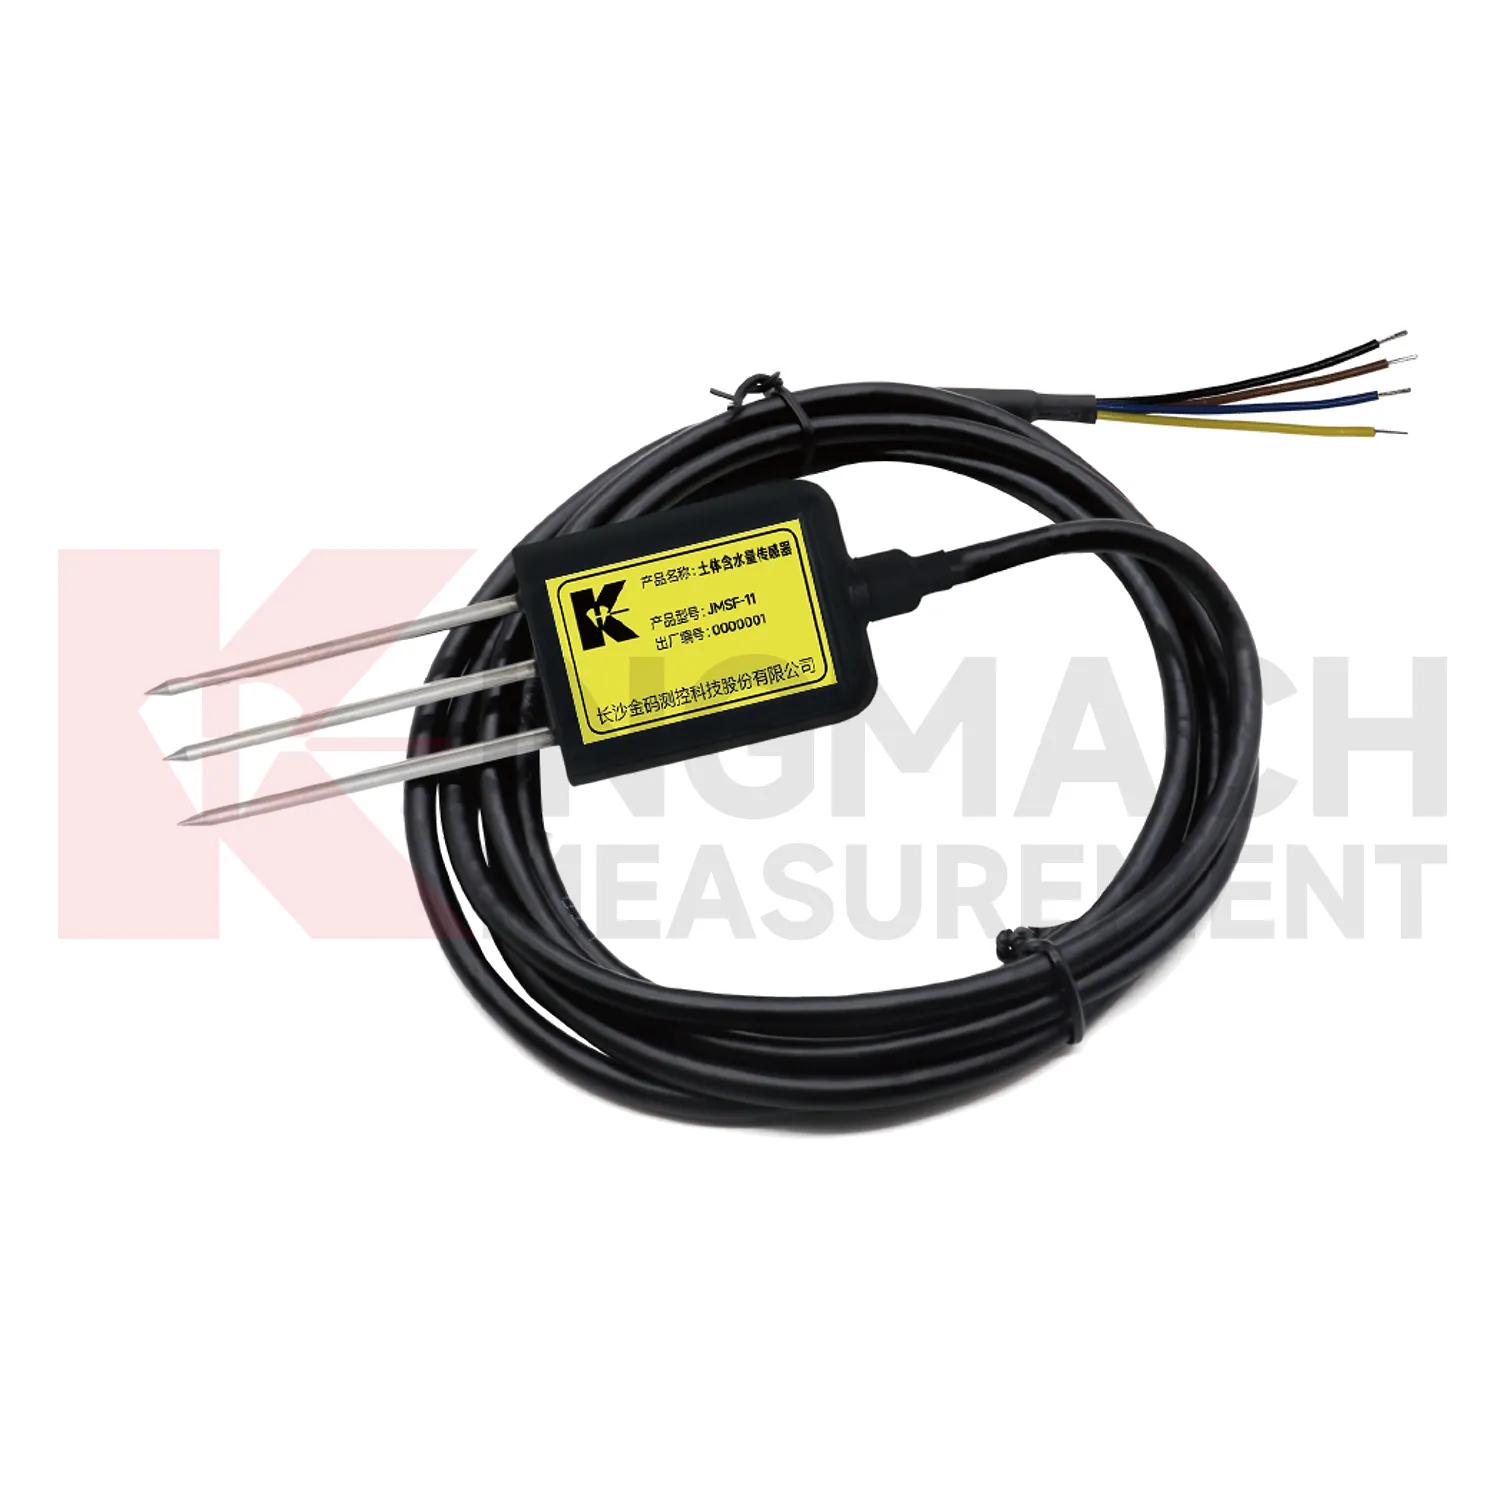
Q: How should soil points be installed?
A: They should have firm contact with the surrounding soil, a recorded depth, protected cable route, and a stable first value.
Q: What should commissioning records include?
A: Include point location, measured condition, unit, mounting photo, cable route, power source, data channel, and linked structural record.
Q: Why are photos useful?
A: Photos help future reviewers understand exposure, mounting, cable routing, and whether later site changes affected readings.
Maintenance teams should record cleaning, access difficulty, enclosure condition, cable repair, vegetation growth, nearby equipment changes, and the first normal reading after work. Those notes protect the meaning of the curve when old data is reviewed months later.
Reviews
Andrew Lee
The visualization software is intuitive and powerful. It helps us analyze monitoring data efficiently.
Christopher Martinez
Very satisfied with the readouts & data loggers. User-friendly interface and supports multiple sensor inputs.
Latest Inquiries
To protect the privacy of our buyers, only public service email domains like Gmail, Yahoo, and MSN will be displayed. Additionally, only a limited portion of the inquiry content will be shown.
Amelia***@gmail.comSingapore
Hello, I am looking for visualization software for monitoring system data analysis. Please let me kn...
Evelyn***@gmail.comSouth Africa
Hi, we are a contractor working on tunnel construction and need settlement sensors and displacement ...
Related product categories
- wind pressure sensor
- ultrasonic wind speed and direction sensor
- wind speed and direction sensor
- wind speed and wind direction sensor
- wind speed and direct sensor
- wireless wind speed and direction sensor
- wind direction and speed sensor
- wind speed and direction sensors
- tipping bucket rain gauge
- tipping bucket rain gauge resolution 0.2 mm standard
- tipping bucket rain gauges
- tipping bucket rain gauge resolution 0.1 mm 0.2 mm standard